Home Energy Survey 2022/2023
- 72% of UK homeowners have cut back on gas and electricity use as a result of the cost of living crisis
- Further windfall taxes have over an 83% approval rating
- 93% of UK homeowners are worried about climate change, but only 18% believe the government is doing enough to combat it

The UK has been battered by several crises in the last few years. With the energy crisis, rising inflation, the cost of living and wages not keeping up, we’ve all been feeling the pinch. Despite the government introducing the Energy Price Guarantee under Liz Truss, our energy bills still increased, so we’ve had to make sacrifices in our budgets. When a new prime minister came in, the chancellor scaled back the plans for the length of this help, causing concern for many households about the prospect of even higher energy bills next year. But this is only one of the issues we look at.
The Home Energy Survey was put together for us to get a glimpse of the attitudes and opinions of homeowners across the UK. It focuses on low carbon technology, government action, new homes and a couple of the crises we’re currently facing. This was done so we could understand the thoughts and feelings towards these issues. For example, while many homeowners would purchase low carbon technology, cost is still the biggest factor affecting their decision to do so. It goes to show that government incentives like the Boiler Upgrade Scheme don’t go far enough to offer meaningful uptake.
We also analyse the data by generation to give an insight into the attitudes across different age groups. While most people understand the importance of combating climate change and installing energy saving measures, a large majority haven’t installed these in their homes. The government’s Net Zero Strategy, which was ruled as unlawful earlier this year, needs to scale up at an increased pace if meaningful change is going to be delivered. Despite Grant Shapps launching the ECO+ scheme late November, the funds available are not going to impact the millions of badly insulated households and those that are currently facing fuel poverty, just a mere couple of hundred thousand.
Since the uptake of our Home Energy Survey has been so well received, we will look to conduct another next year to see if attitudes have shifted and whether the government has implemented enough meaningful change. The useful insights the surveys provide help us shape future content and allow us to understand what the public wants to read more about.
What's On This Page?
Click the links below and head straight to a specific section of the article.
Key Findings
72% of UK homeowners have cut back on gas and electricity use as a result of the cost of living crisis
Almost a fifth of UK homeowners haven’t given any thought about reducing their energy bills through low carbon technology
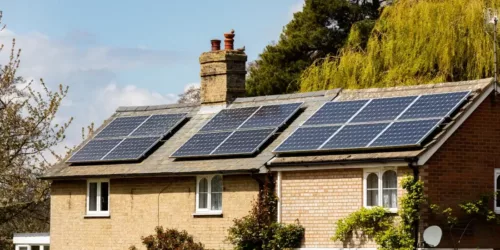
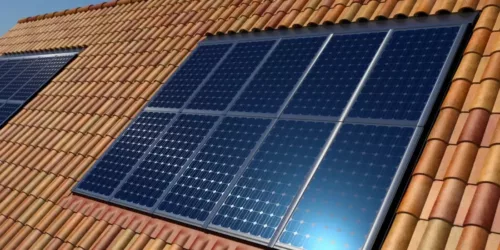
Existing low carbon technologies in a property are preferential to 81% of UK homeowners, with a 59% leaning towards solar panels
Over 75% of UK homeowners would look for a high EPC rating when moving home
Plans to purchase low carbon technology in the near future is in mind for 43% of UK homeowners
93% of UK homeowners are worried about climate change, but only 18% believe the government is doing enough to combat it
The energy crisis is a cause of worry for 97% of UK homeowners
64% of UK homeowners believe the government needs to change its actions the most in order to limit climate change
62.5% of UK homeowners believe green energy is the way forward to achieve energy security
Further windfall taxes have over an 83% approval rating
Sales people are the least trusted group, with an approval rating of 2%. The government is one of the worst at 8%
Household Attitudes
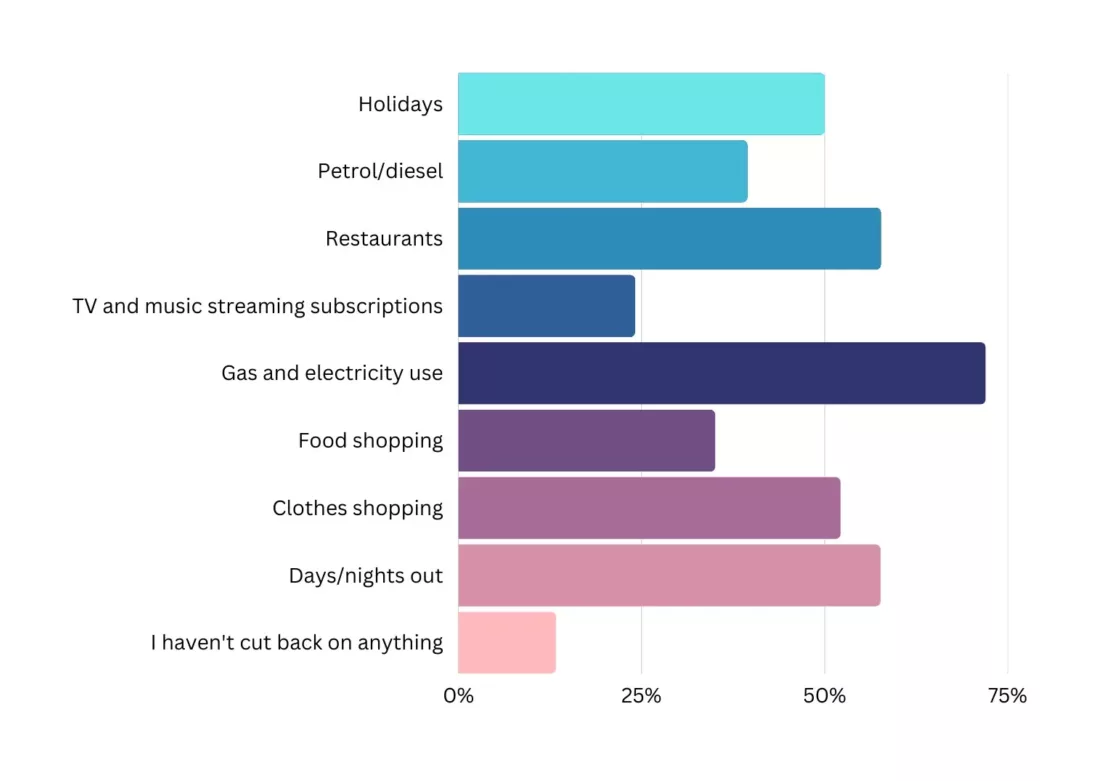
Have you cut back on any of the following expenditures as a result of the rising cost of living and inflation?
Findings
Petrol prices have rocketed this year at least partly as a result of Russia’s war with Ukraine. With food prices going up and inflation soaring, UK residents have been forced to make cutbacks. Inflation has seen record levels thanks, in part, to Liz Truss’ economic policy and the Bank of England’s bailouts. Almost 40% of people have cut back on filling up their vehicle as a result of these costs and a staggering 72% have reduced their energy use as a way of cutting costs.
72% of people have cut back on their electricity and gas use
Over ⅓ of UK homeowners have reduced their food shopping spend
Only 13% of UK homeowners haven’t cut back on any of their normal expenditures
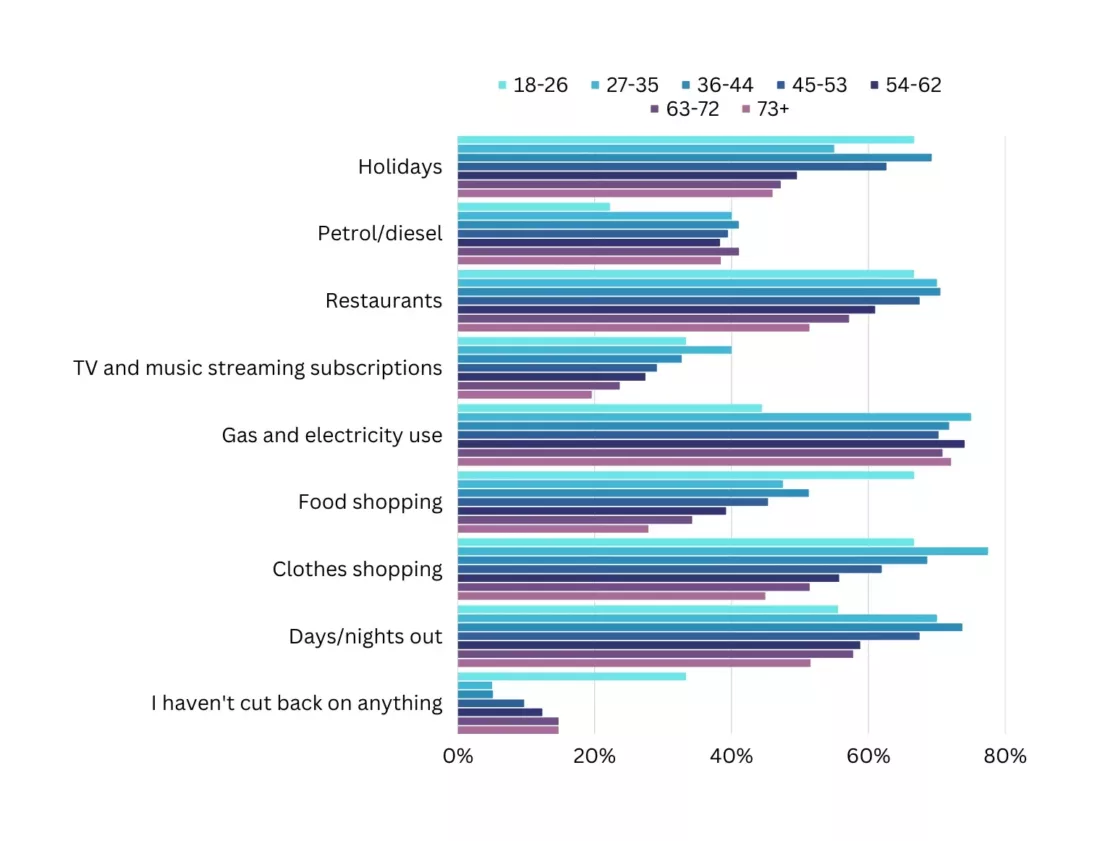
Breakdown by age
Findings
The rising cost of living and inflation has hit us all, but the findings are fairly consistent across different age groups. The biggest reduction in any age group is in clothes shopping in 27-35 year olds, at 77%, while the smallest percentages are found across all age groups not cutting back on anything, from 5%. 18-26 year olds have the biggest percentage of making no cutbacks, which is also the same percentage that has cut back on TV and music subscriptions.
Petrol and diesel use has been cut fairly consistently across all age groups, but 18-26 year olds are the lowest at just over 22%. In terms of food inflation, only just over 28% of people 73 and over have cut back on their spending. Days/nights out have been cut back by exactly 70% of 27-35 year olds, which is the second-highest figure.
Over ¾ of 27-35 year olds have cut back on clothes shopping the most
Petrol and diesel has been reduced by about 40% across all age groups
Between 5% and 33% of all ages haven’t made any cutbacks
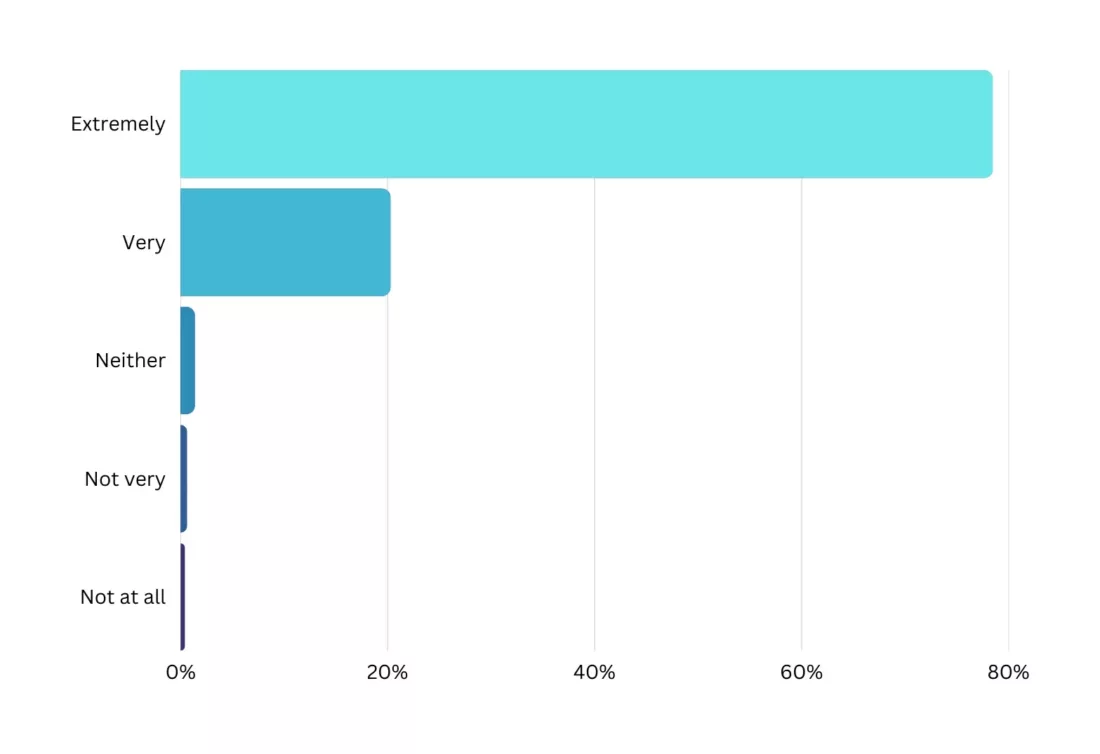
How important do you think insulating a home is?
Findings
Home insulation is the best way to cut energy bills and increase the amount of heat in our homes. Having well insulated buildings will help us on our journey to net zero. The government is helping hundreds of thousands of homes install insulation next year, but 19 million homes in England and Wales don’t have sufficient insulation and nearly 7 million homes are currently suffering from fuel poverty. Fortunately, the general population understands the importance of insulating a home, as 78% of UK homeowners believe insulation is extremely important, while a further 20% say it’s very important.
78% of people think home insulation is extremely important
Only 2% of the UK population are either indifferent or dismissive of the importance of insulation
Breakdown by age
Findings
All age groups have a fairly consistent opinion on insulation, except for 18-26 year olds, who are 33% at the top and bottom brackets. Perhaps informing and educating the younger demographics needs to be at a constant pace. The next closest percentage is in 27% of 36-44 year olds who think insulation is only very important.
No 18-35 year olds are ambivalent about insulation or think it’s not very important, but between 0% and 2% of all other ages are. The highest advocates of insulation are found in 54-62 year olds at 80%, followed by 27-35 and 45-53 year olds at 79%. It’s reassuring to see that insulation has crossed most people’s minds, regardless of age.
⅘ of 54-62 year olds believe insulation is extremely important
2% of 36-44 year olds are indifferent about insulation or don’t think it’s very important
Have you recently replaced or installed insulation?
Findings
Insulating a home is an expensive undertaking, which is one of the reasons why millions of people face fuel poverty every year. Even though you save money in heating costs once insulation is installed, having the initial funds for loft or wall insulation is still too difficult for many. Loft insulation can start at around £500, but installation costs and extra work can easily drive this up. If we consider that 87% of UK residents have made cutbacks on their household spending this year alone, it’s no wonder that fewer people have recently installed insulation.
Only 31% of UK homeowners have installed insulation recently
Breakdown by age
Findings
The highest uptake in any demographic is in 54-62 year olds at 34%, whereas the lowest is in 18-26 year olds at 11%. Conversely, the biggest percentage of people who haven’t installed insulation is in 18-26 year olds at 89%, and the lowest number of people who haven’t is in 54-62 year olds at 66%.
There’s a trend of 69% of people who haven’t installed insulation, with more of the younger demographic not having done so, perhaps more because of the costs associated with it.
34% of 54-32 year olds have installed insulation recently
89% of 18-26 year olds haven’t
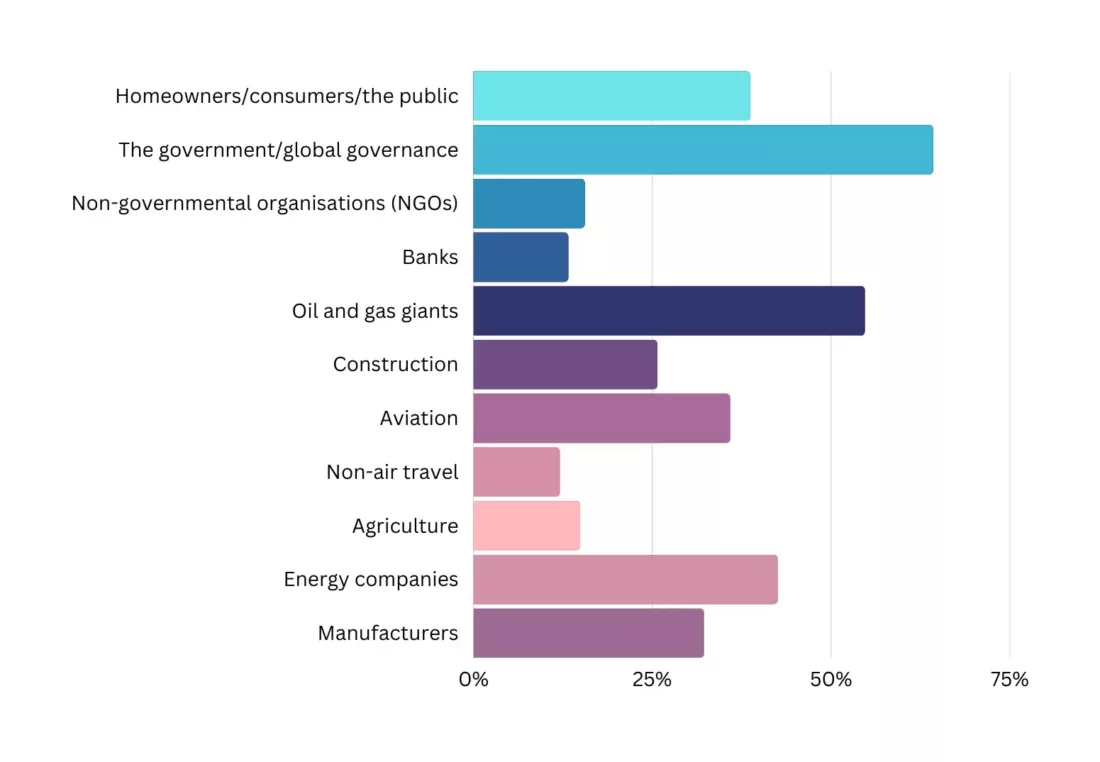
Who do you think needs to change their actions the most to limit climate change?
Findings
It’s well understood that climate change is an issue that affects us all and no one is exempt from having an impact. In 2020, transport became the biggest polluter of greenhouse gases at 24%, followed by the supply of energy at 21%. Households only produced 16% of emissions that year. In light of the issues surrounding COP27 and soaring profits for oil and gas giants this year alone, households believe that more change is needed from up top in order to limit the impacts of climate change. The government, oil and gas giants and energy companies were the top choices.
64% of UK homeowners believe the government should change its actions the most out of all other sectors
55% of people want oil and gas giants to change
12% believe non-air travel should change their actions
Breakdown by age
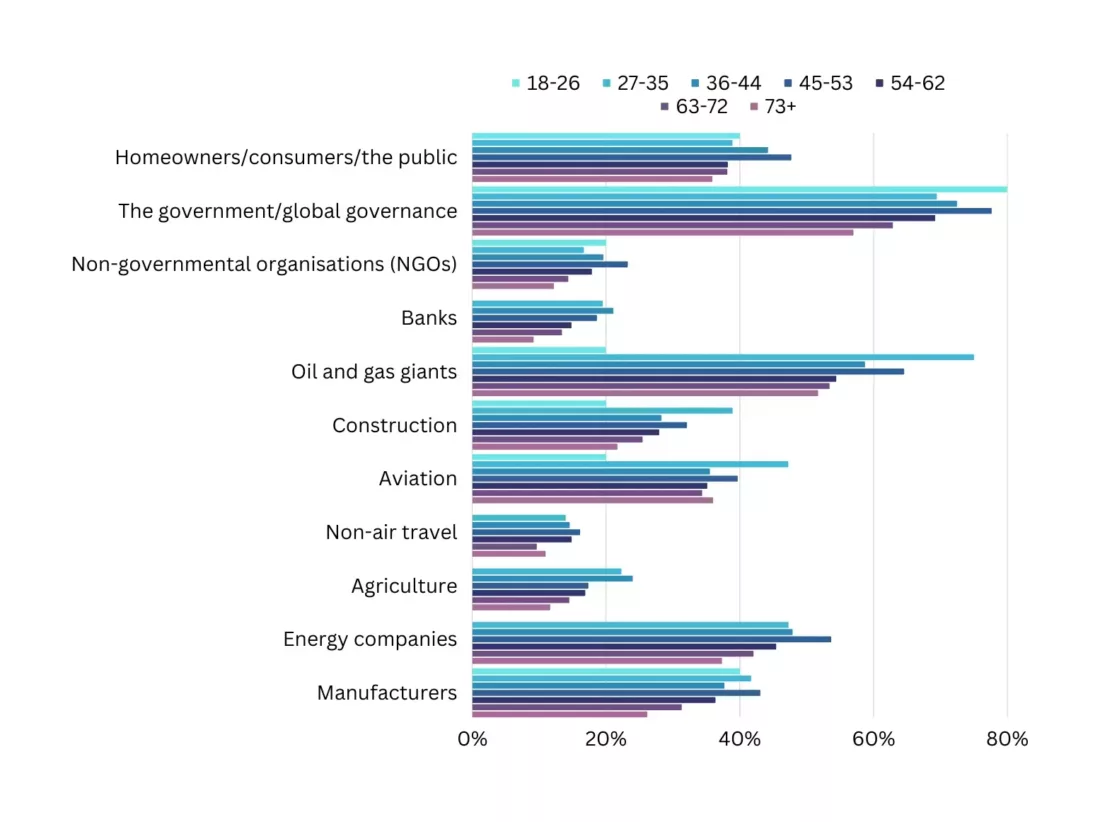
Findings
With the government needing to change according to 64% of people, this is the biggest percentage in 18-26 year olds at 80%. This age group doesn’t believe banks, non-air travel, agriculture or energy companies need to change their tact. Only 9% of people aged 73+ think that banks should change their actions the most, but their biggest percentage is also for the government, at 57%, which makes them the demographic that trusts the government’s climate change policy the most.
Oil and gas giants, who have been reaping great profits in the energy crisis, are most targeted by ¾ of 27-35 year olds, although their most trusted climate group is non-air travel at only 14%. Homeowners and consumers are voted the highest by 45-53 year olds, and the lowest by those 73 and over.
80% of 18-26 year olds believe the government should change the most
9% of those 73 and over think that banks should change the most
How much trust do you place in the following types of company/business?
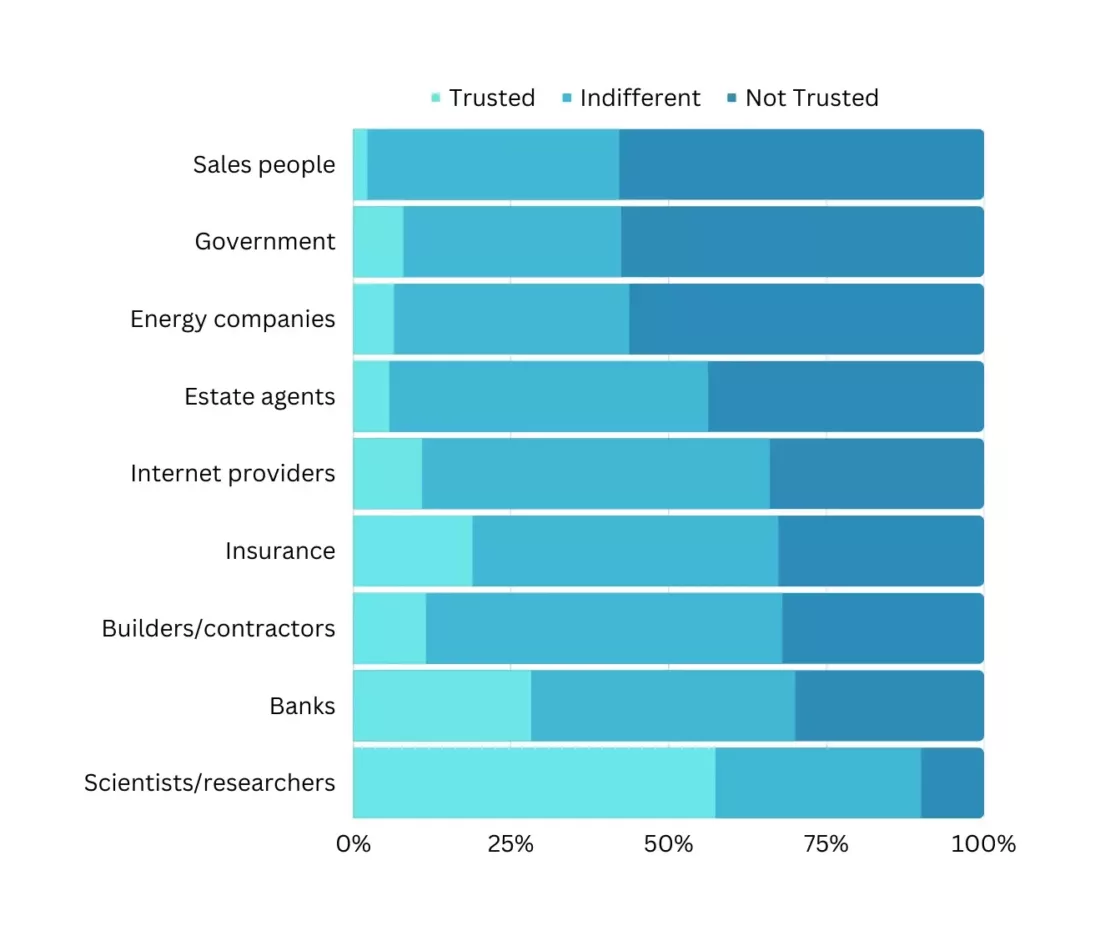
Findings
We’re all told information from various people throughout our daily lives and some groups of people’s opinions carry more weight than others. In the age of increasing environmental awareness, scientists and researchers came out on top as the most trusted group, followed by banks and insurance providers. The least trusted were sales people, the government and energy companies. It’s interesting that banks are trusted quite highly despite how much they finance fossil fuel projects in order to make money. HSBC was even accused of greenwashing earlier in the year for not admitting how much it’s contributing to greenhouse gases.
Scientists/researchers have a 57% trust rating
Sales people and the government both have a 57% untrusted rating
Only 8% of UK households trust the government
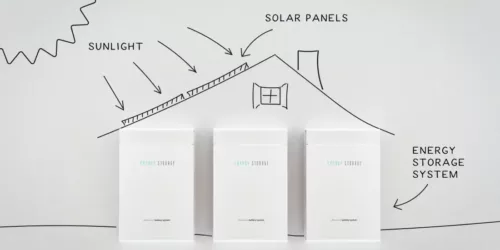
Low Carbon Technology
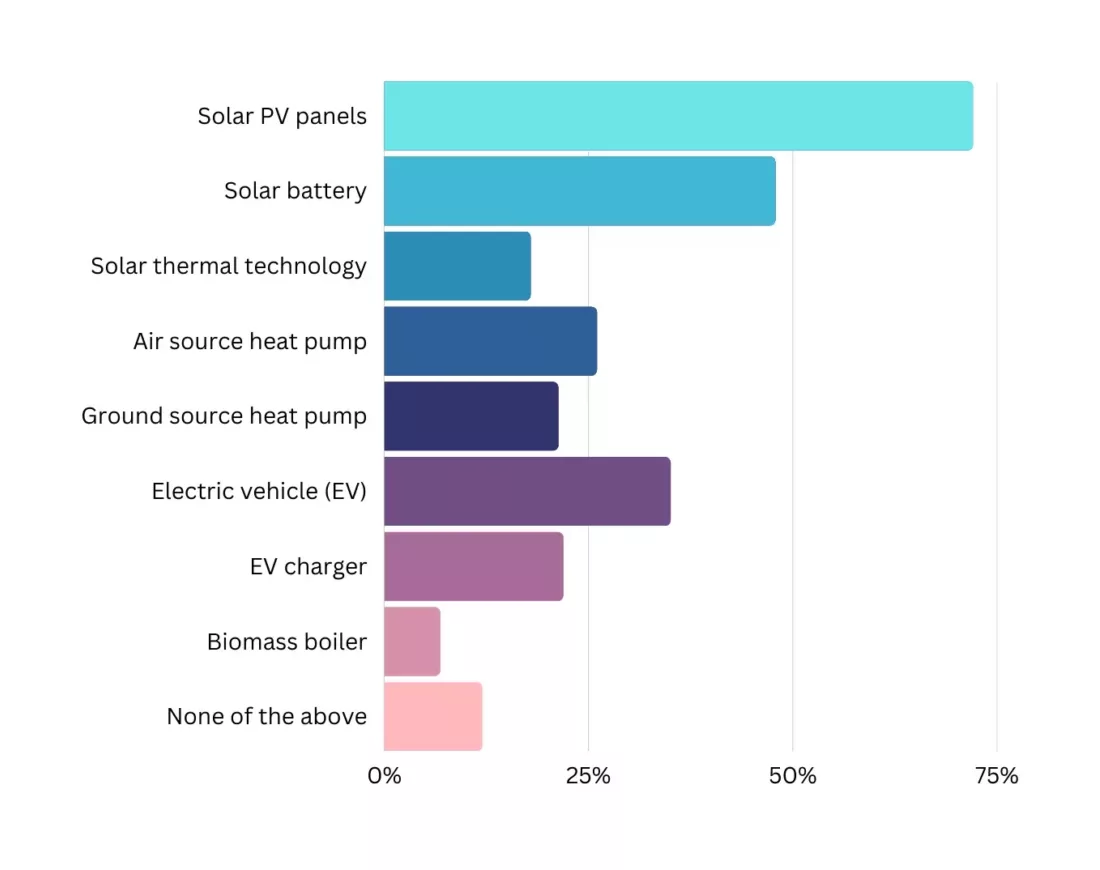
Tick all of the low carbon technologies that you know about
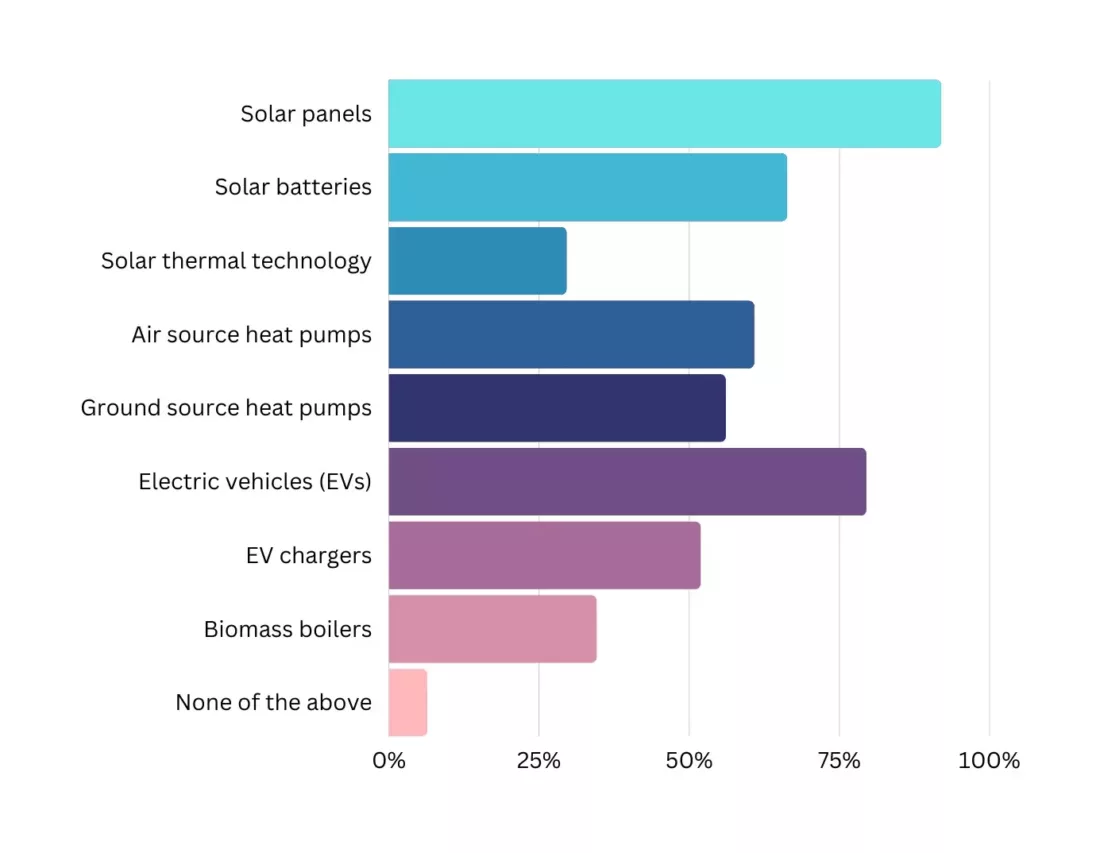
Findings
It’s all very well pushing for net zero, but it needs to be done in an engaging and informative way. With the emergence of low carbon technology, the public needs to be informed if any meaningful uptake is to be expected or things can easily go under the radar. There’s a gap of 28% between people who are aware of electric vehicles and those who know of EV chargers. Solar panels were the most well known technology, at 92%. Heat pumps have gained some ground in recent years as households have started to look into the alternatives to gas boilers, with 61% and 56% of people having heard of air source and ground source heat pumps respectively.
Solar panels are known by 92% of UK households
Solar thermal technology was only known by 29% of people
6% of people had not heard of any low carbon technologies
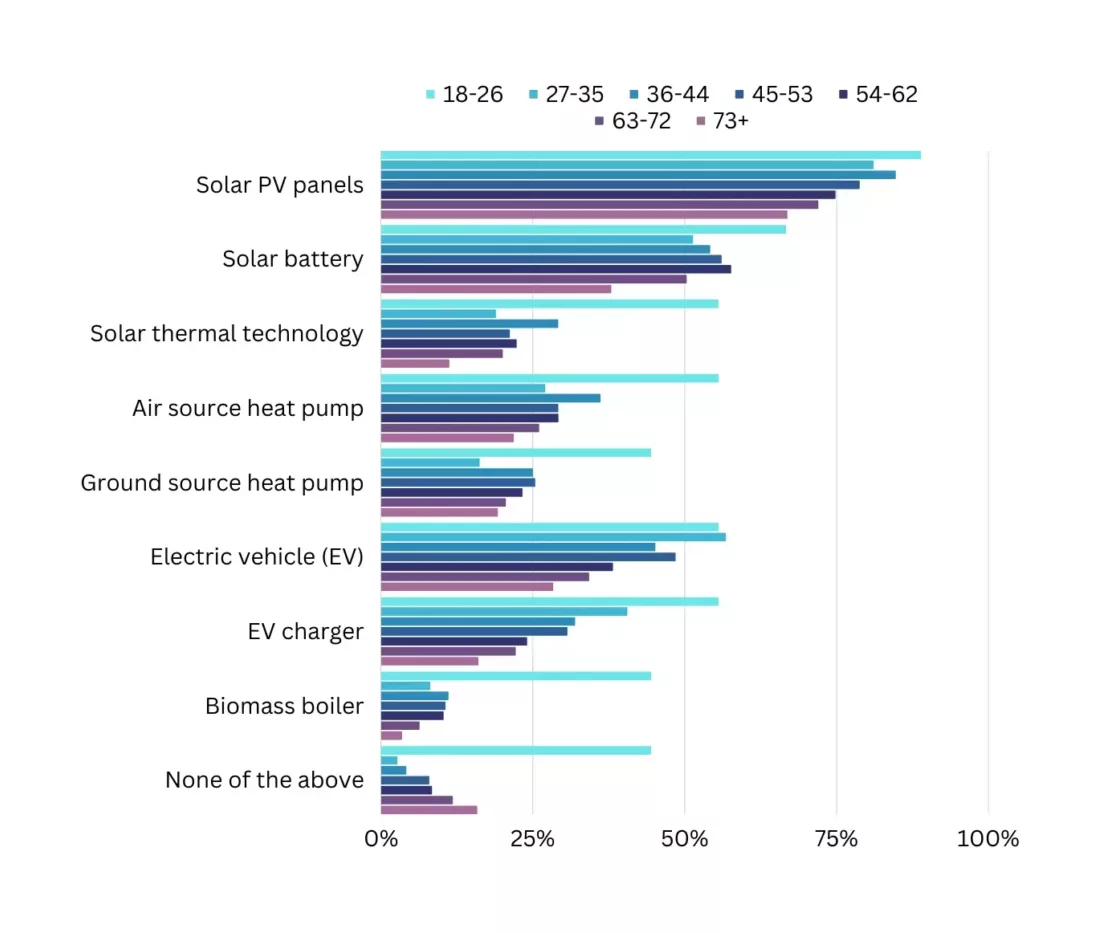
Breakdown by age
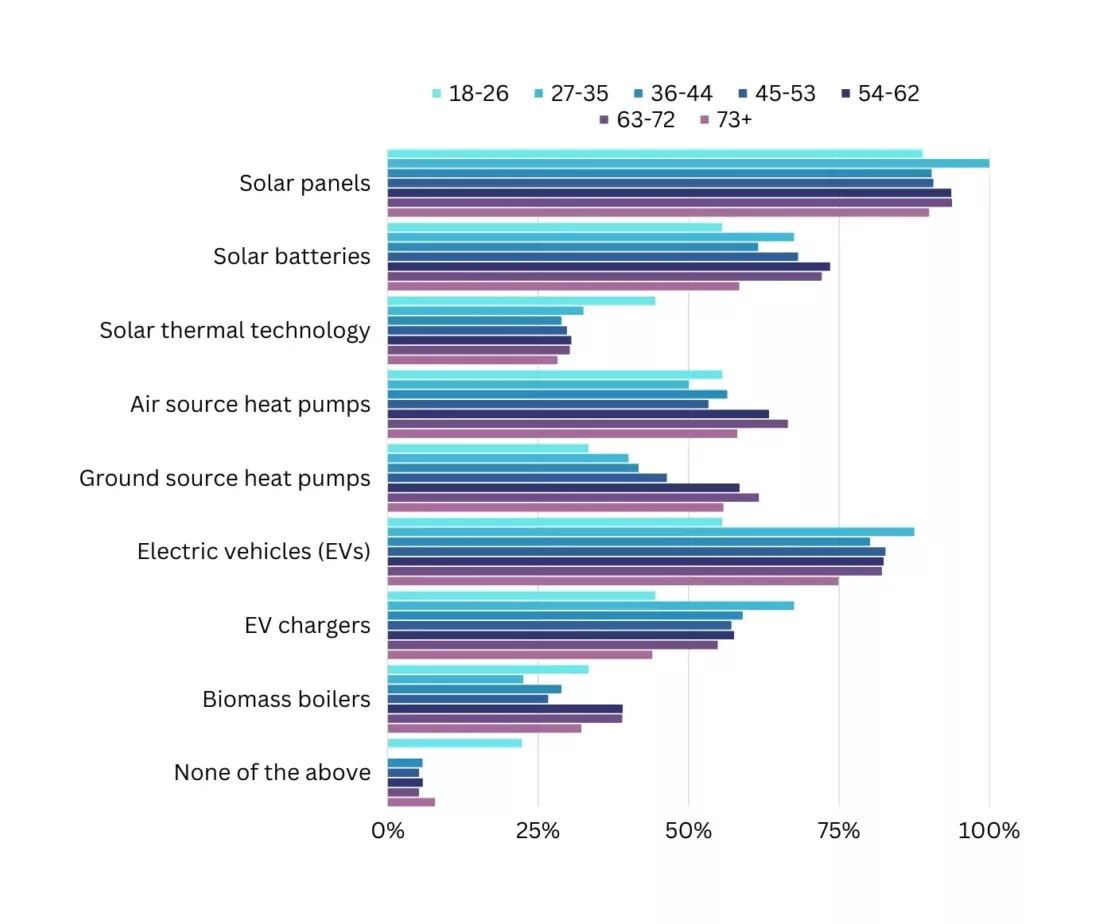
Findings
Awareness of low carbon technology is almost consistent throughout the different age groups. The highest percentage is found in 27-35 year olds, who all know about solar panels, compared to 89-94% in other age groups. Solar batteries, on the other hand, are least known by 18-26 year olds, even worse than 58% of those 73+.
The most informed age group is 27-35 year olds, compared to 22% of 18-26 year olds who don’t know any of the listed technologies. There’s a gap of 31% of people aged 73+ who know about EVs and who don’t know about EV chargers, with the lowest disparity in 18-26 year olds, at 11%.
100% of 27-35 year olds know about solar panels
55% of 18-26 year olds are aware of solar batteries
None of the listed technologies are known by 22% of 18-26 year olds
Cost aside, would you purchase any of these low carbon technologies?
Findings
In an ideal world, we could kit out homes out with as much energy generating technology as we would like or replace existing systems with low carbon ones. As cost has a huge bearing on whether consumers would implement low carbon technology, given the choice to have any of these systems for free offers huge insight into attitudes. More people would rather not have any system on offer than choose a biomass boiler. Solar panels were the most popular choice, with 72% opting for them, followed by solar batteries and EVs. As the systems can be interconnected, the logic is clear.
Solar panels are the most popular choice at 72%
35% of people would have an EV for no cost
¼ of people would choose to have an air source heat pump for free
Breakdown by age
Findings
Free solar panels are most favoured by 18-26 year olds, at 89%, and the best option for those 73+, at 67%. Biomass boilers, on the other hand, are only approved by 3% of those aged 73+, but endorsed by 44% of 18-26 year olds.
Given the option to have any of these low carbon technologies for free, 44% of 18-26 year olds won’t bother, with only 3% of those 27-35 thinking the same. EVs are only preferred by the younger generations, with a 57% uptake for 27-35 year olds.
89% of 18-26 year olds would choose to have solar panels
3% of people aged 73+ would fit a free biomass boiler
3% of 27-35 year olds wouldn’t choose to have any fitted
Do you currently have plans to purchase any of the following low carbon technologies in the near future?
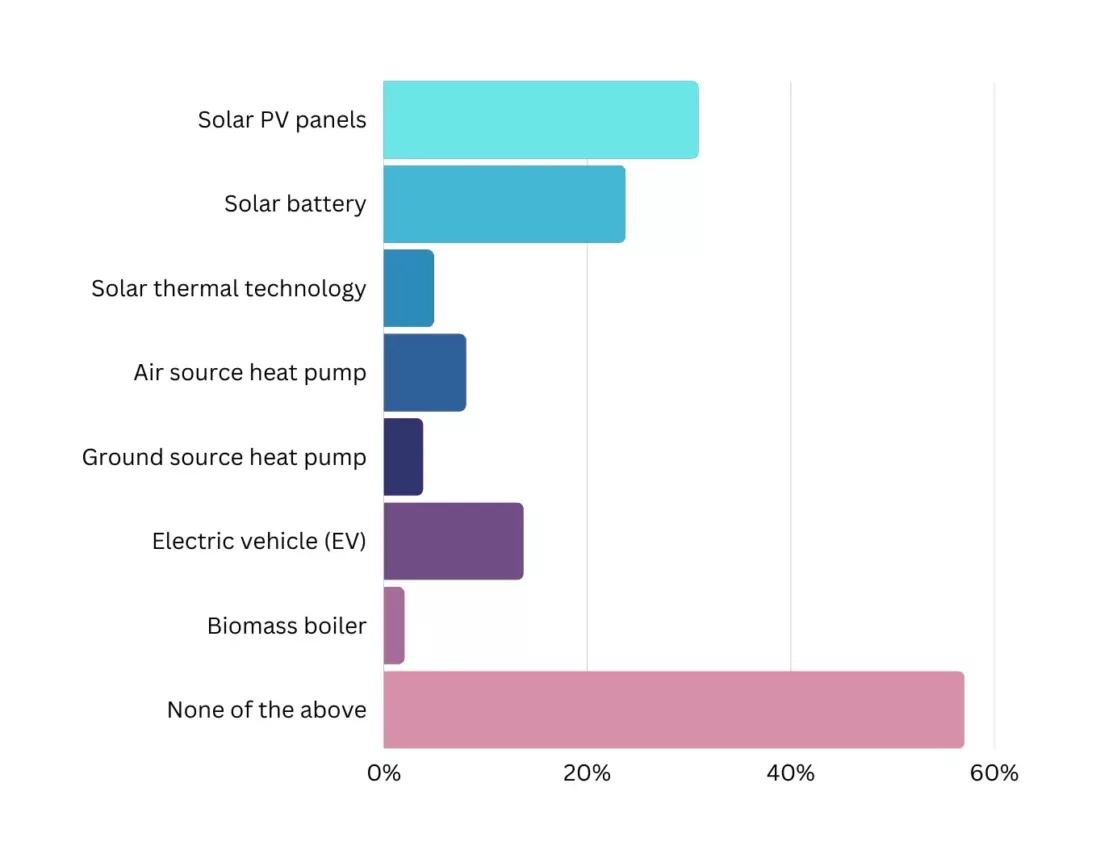
Findings
As spending cuts have hit household budgets, it’s hard to plan for big expenditures in the future. Replacing a heating system with a low carbon version can be incredibly costly. With the Energy Price Guarantee coming to an end in April 2023, food inflation going above 12% and wages not rising, everyone has been feeling the pinch. As such, plans to purchase low carbon technology have been put on the back burner. Despite the popularity of solar panels, only 31% of UK households have plans to purchase them in the near future.
57% of UK households have no plans on purchasing any low carbon technology at the moment
Solar panels are planned to be bought by 31% of people sometime soon
Only 2% of households plan on buying a biomass boiler
Breakdown by age
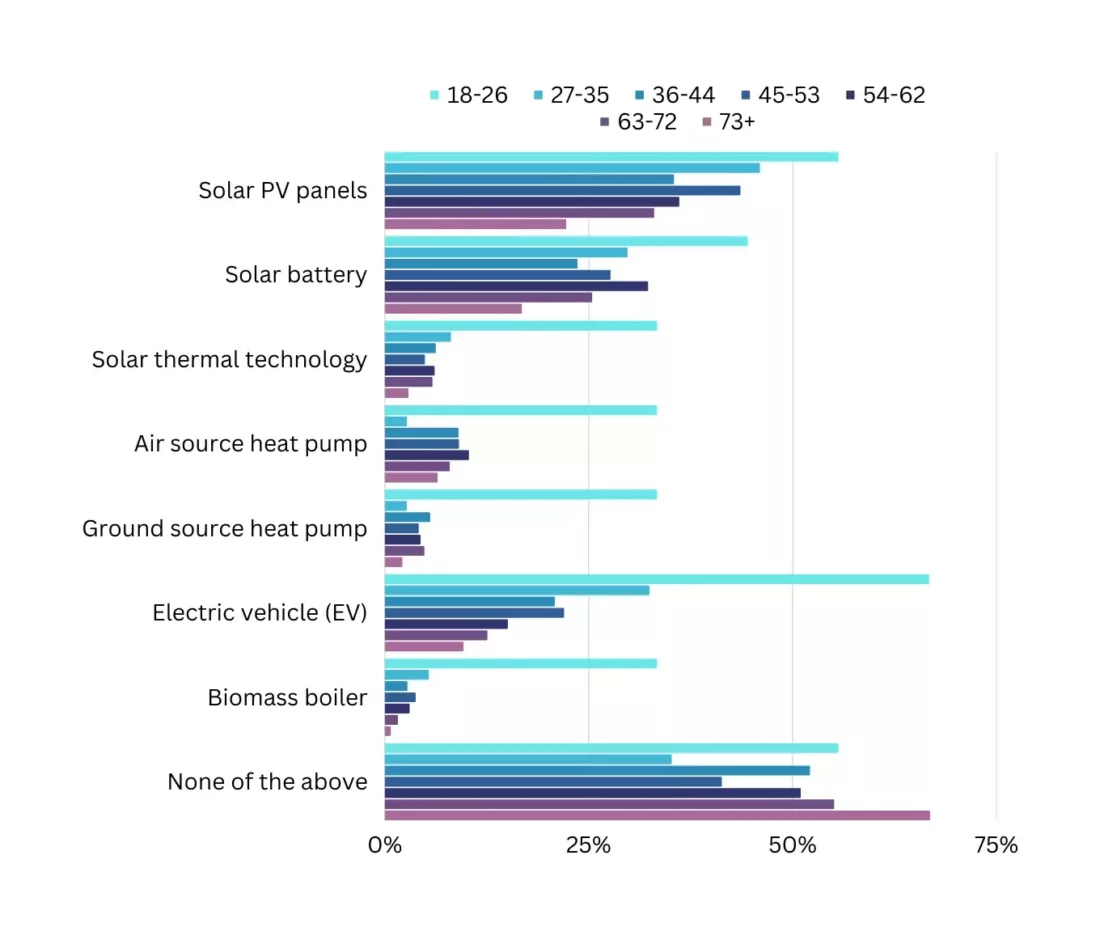
Findings
Plans to purchase low carbon technology are least in the minds of people aged 73+ at 67%. This figure is halved in 27-35 year olds at 35%. This survey highlights how cost is always an issue with low carbon technology, which would explain why this figure is so high across all ages, except 18-26 year olds.
EV uptake is most popular in 18-26 year olds, with over ⅔ of the age group looking to buy one in the near future. This age group is also the most likely to buy any of the other low carbon technologies on offer, with just over 55% looking to also buy solar panels. Those aged 73+ are the most frugal, with only a 22% interest in buying solar panels soon.
67% of 18-26 year olds are looking to buy an EV
67% of people aged 73+ are not considering buying any low carbon technology soon
Is there anything specifically preventing you from purchasing these?
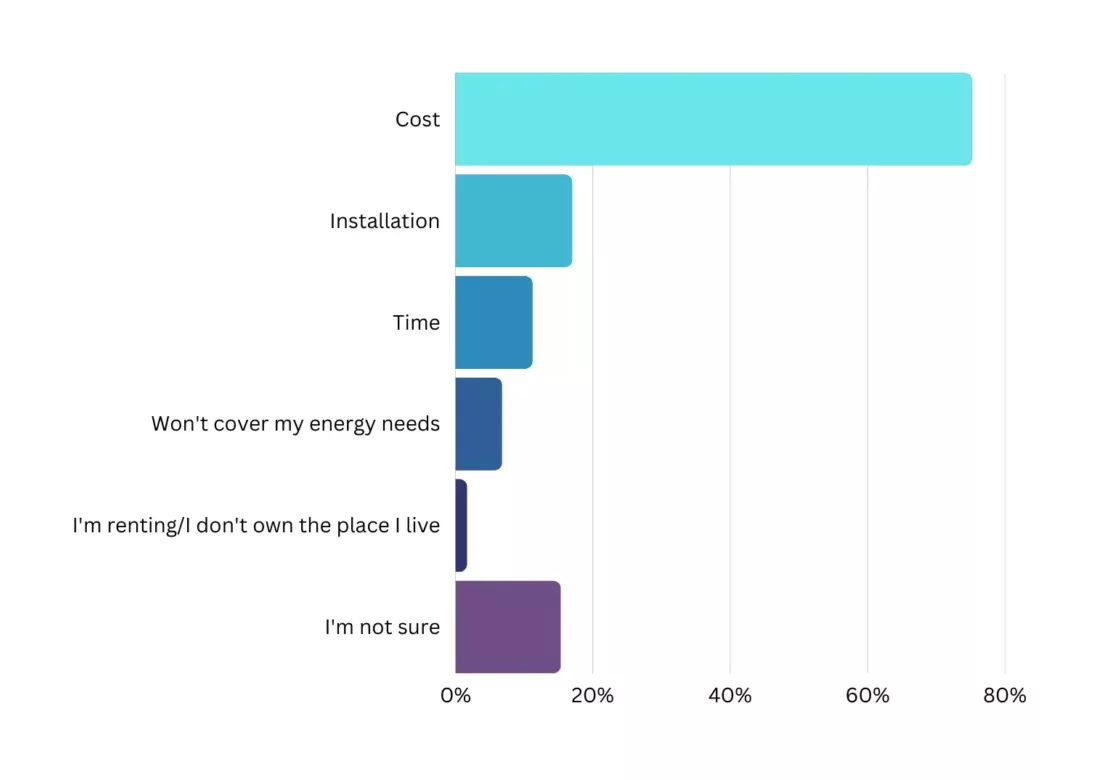
Findings
When pushed, cost was the biggest hurdle in uptake of low carbon technology. Over ¾ of UK homeowners specified that cost was the biggest factor in preventing them from purchasing any system. Despite the government’s Boiler Upgrade Scheme offering up to £6,000 off a heat pump, they are still too expensive for the average household to even consider purchasing. 15% of respondents didn’t know what was holding them back, which is why education and information is so important, not just in the current climate.
75% of people say cost is the biggest factor with low carbon technology
Almost 7% of UK households are put off from low carbon technology because they believe it won’t cover their energy needs
Rank these factors in order of importance when it comes to low carbon technologies
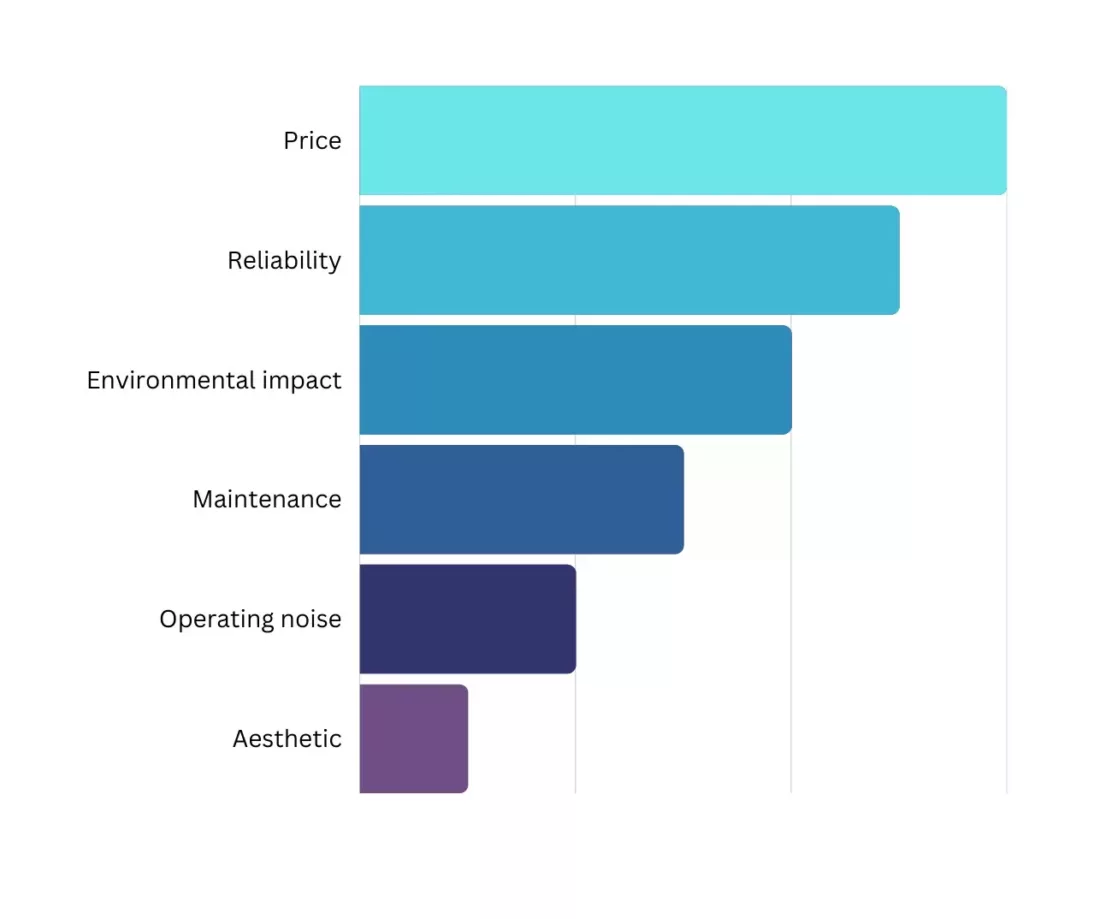
Findings
When it comes to using new technology, people are often put off by something specific. Likewise, it’s also important that some features are prioritised in order to become more desirable. Almost ⅖ of people specified that price was the biggest factor with low carbon technology, whereas over 50% of people believed the appearance was of least concern. 31% of UK homeowners put the environmental impact as their top choice.
39% of people believe price is the most important factor
31% believe the environmental impact is the most important
Only 4% of UK homeowners believed the operating noise was the most important factor
New Homes
When moving home, would an existing low carbon technology make it more appealing to you (e.g., solar panels, heat pump, etc.)?
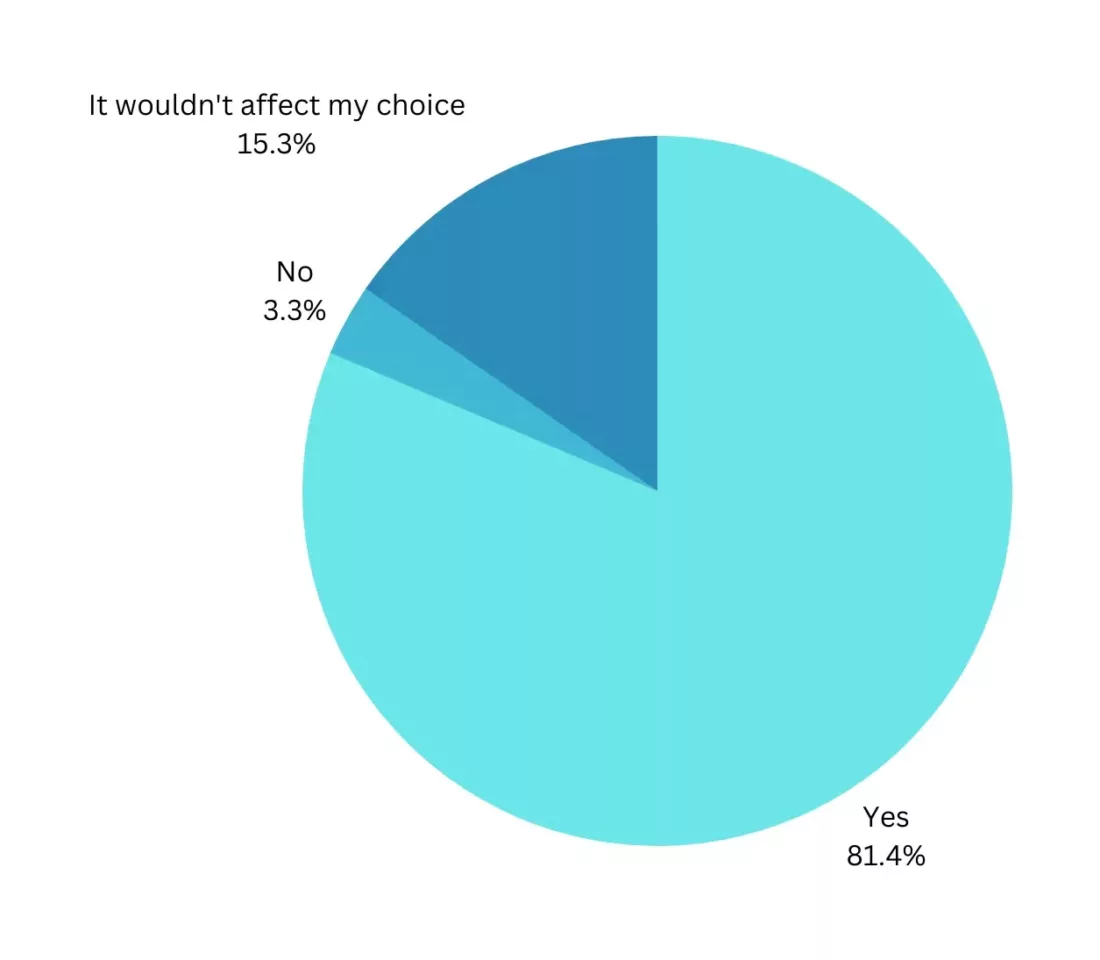
Findings
Moving home is always a stressful time, but moving into a home that already has low carbon technology can make it more appealing from the offset. You can expect to receive lower energy bills and can be content that your house isn’t contributing to climate change as much as other people. Just over 3% of UK homeowners wouldn’t find this more appealing, but a staggering ⅘ will. It’s no wonder that installing low carbon technology can add value to your home as it becomes more prominent in people’s minds.
Over 81% of UK households would prefer a new home with existing low carbon technology
A house with low carbon technology wouldn’t affect the choice of a little over 15% of UK homeowners
Breakdown by age
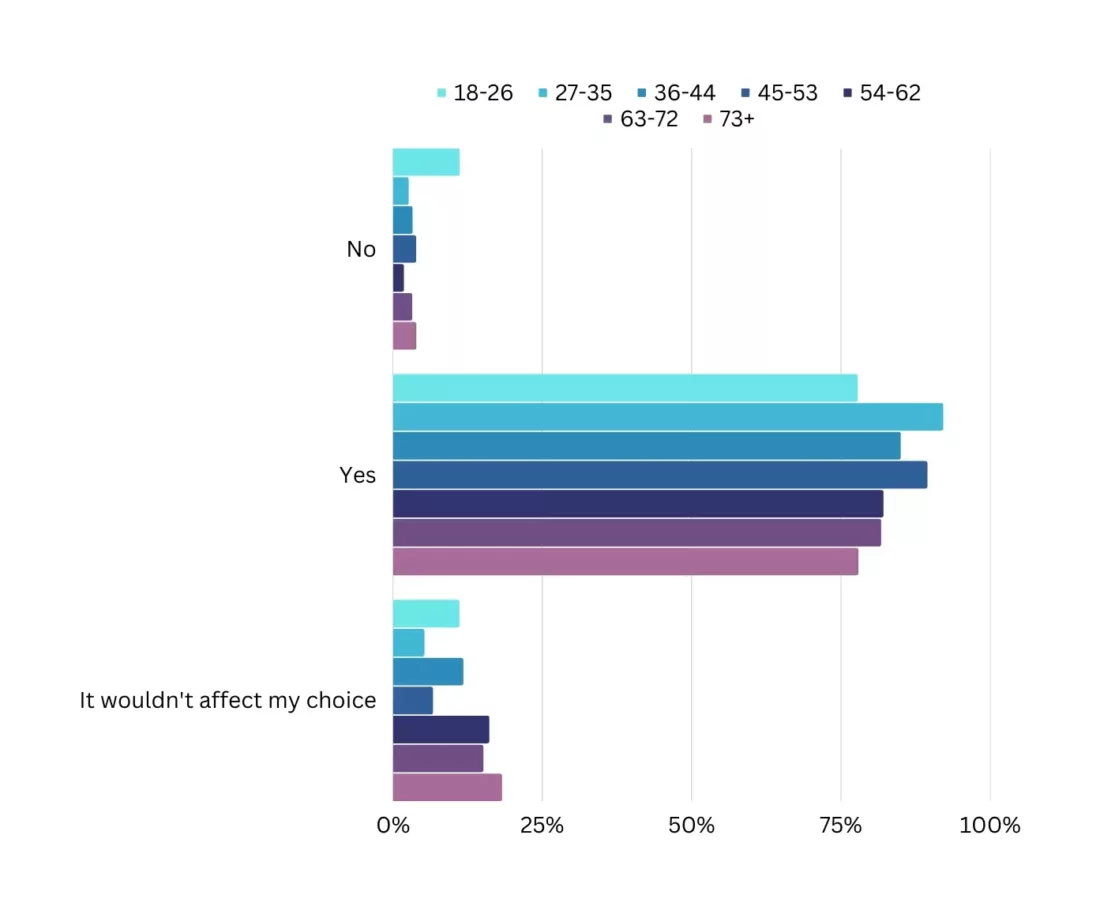
Findings
These findings are fairly consistent between all age ranges, with 11% of 18-26 year olds not bothered by the existence of low carbon technology installed at a new home, compared to around 2-3% for other age groups.
92% of 27-35 year olds would be swayed by a home with existing low carbon technology
It wouldn’t affect the choice of 5% of 27-25 year olds
Which system would most affect your decision?
Findings
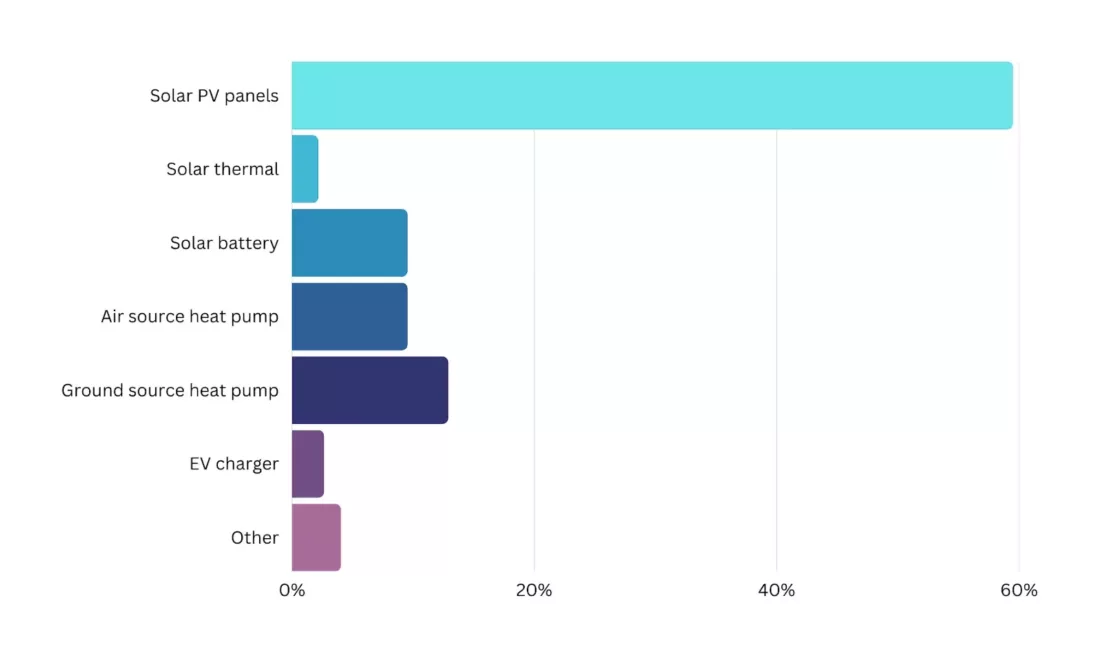
The more important question is what low carbon technology people are most interested in their home already having. Almost 60% of people chose the ever-popular option of solar panels, while almost 13% opted for ground source heat pump. Seeing as these systems are incredibly intrusive in their installation, it makes sense if the work is already done at a different property ready for you to move in to and utilise. Almost 3% of homeowners would prefer a home EV charger overall, which is the cheapest way of charging an EV.
60% of people would prefer solar panels on their new property
Just over 2% of UK homeowners would prefer free hot water in the summer from solar thermal technology
Breakdown by age
Findings
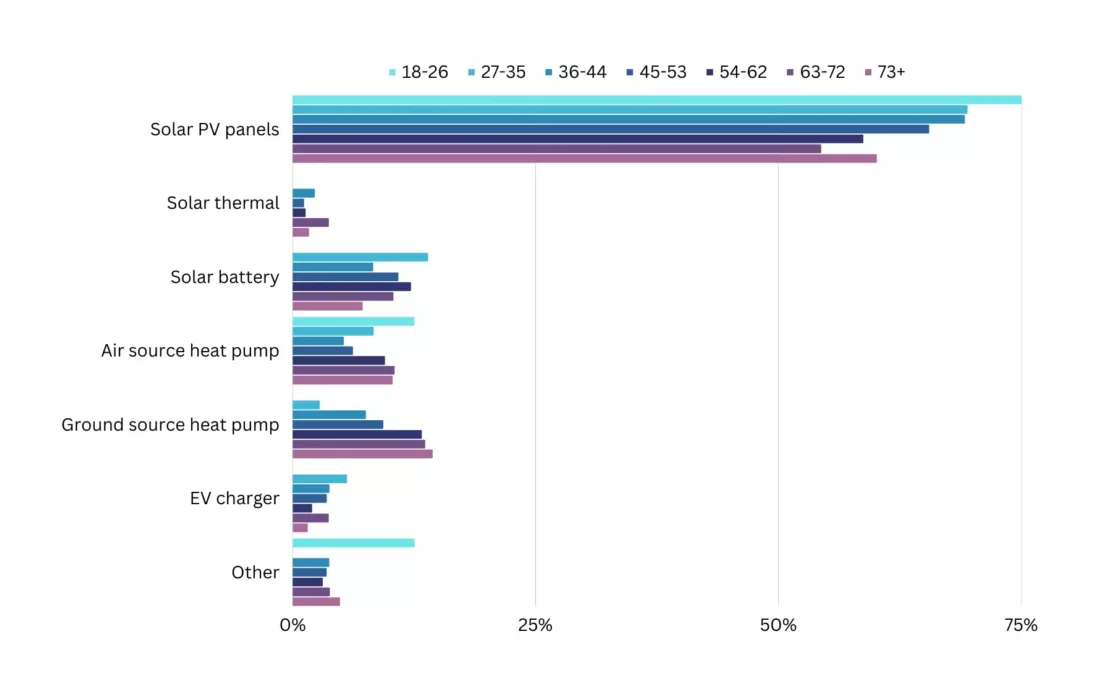
Solar panels are favoured by 18-26 year olds the most, with ¾ opting for them, but only 54% of 63-72 year olds doing the same. No 18-26 year old would prefer a ground source heat pump, solar battery, solar thermal technology or an EV charger. Solar thermal is the least likely technology to have an impact, with only 4% of 63-72 year olds preferring it.
While low carbon technologies other than solar panels can have an impact on household bills, people of all ages are not swayed by them as much. A ground source heat pump is most favoured by older generations, with an approval rating of 14% for those aged 73+.
75% of 18-26 year olds would be swayed by solar panels the most
An EV charger would be preferential for 5% of 27-35 year olds
Every home in the UK has an Energy Performance Certificate (EPC). This is a rating of how much it might cost you to run and heat. Would a high EPC rating affect your choice of house when moving?
Findings
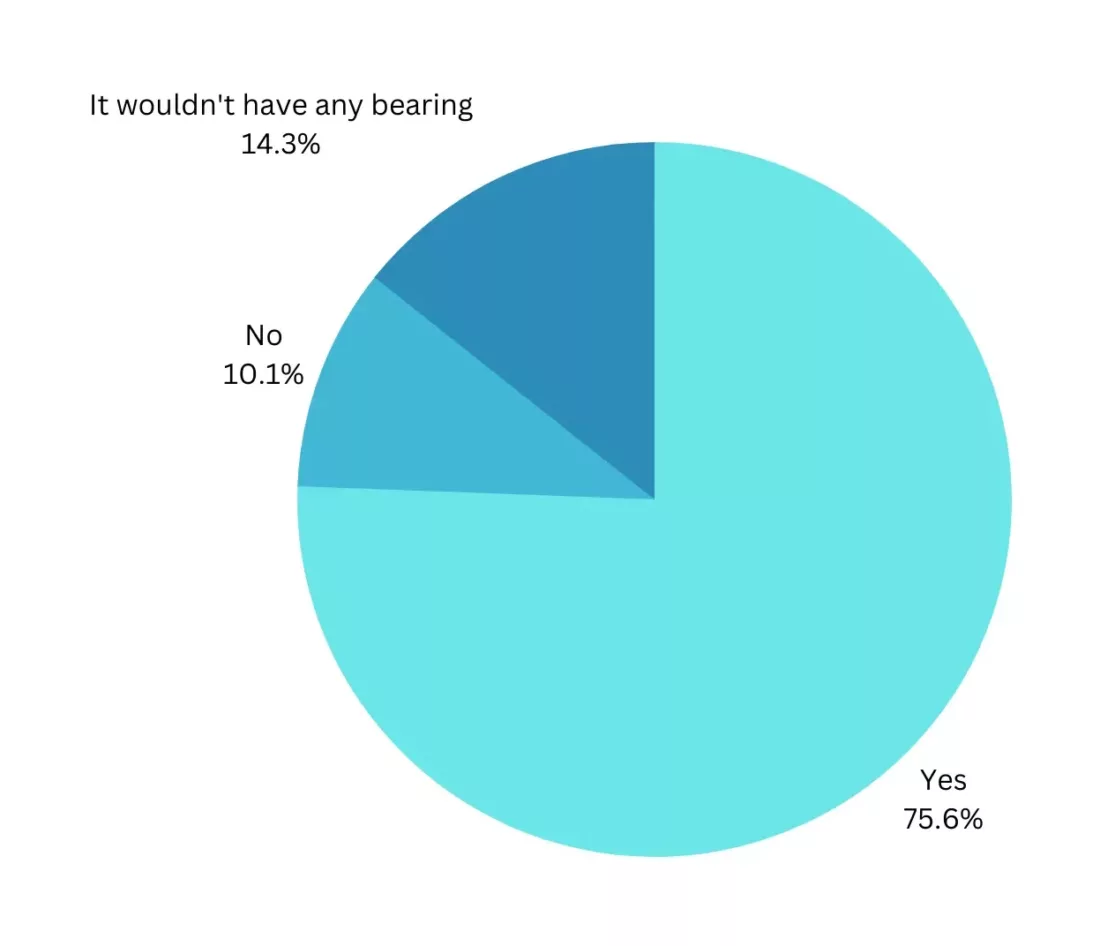
EPCs are vital pieces of information. They give your home recommendations on how to improve its energy efficiency, such as installing insulation. An EPC is usually valid for 10 years and one should always be available when moving or selling home. The most energy efficient homes are highly rated and are cheaper to heat and run. As homeowners are becoming more aware of their environmental impact and how money can be saved with an efficient home, it’s no surprise that a high EPC rating is important for over ¾ of people. Only just over 10% of UK households wouldn’t take this into consideration.
Over 75% of people would prefer a high EPC rating for a new home
Under 15% of UK homeowners wouldn’t be swayed by the EPC rating of a home
Breakdown by age
Findings
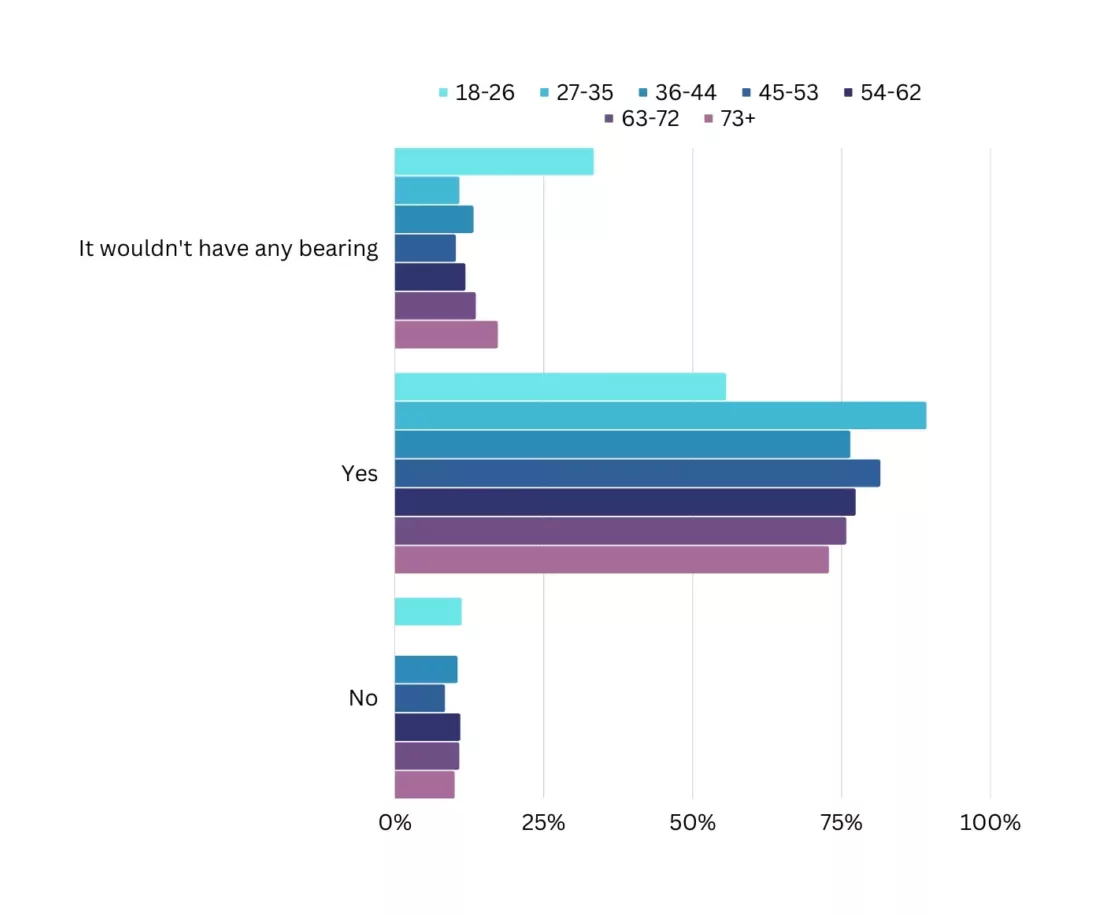
EPCs are incredibly useful and homeowners are becoming increasingly aware of how important they are when moving home. 89% of 27-35 year olds would prefer a high EPC for a new home, whereas only 55% of 18-26 year olds would. The EPC rating wouldn’t have any bearing for ⅓ of 18-26 year olds.
89% of 27-35 year olds would prefer a high EPC rating for a new home
A high EPC rating wouldn’t have any bearing for 33% of 18-26 year olds
Did you know EPCs can go above 100?
Findings
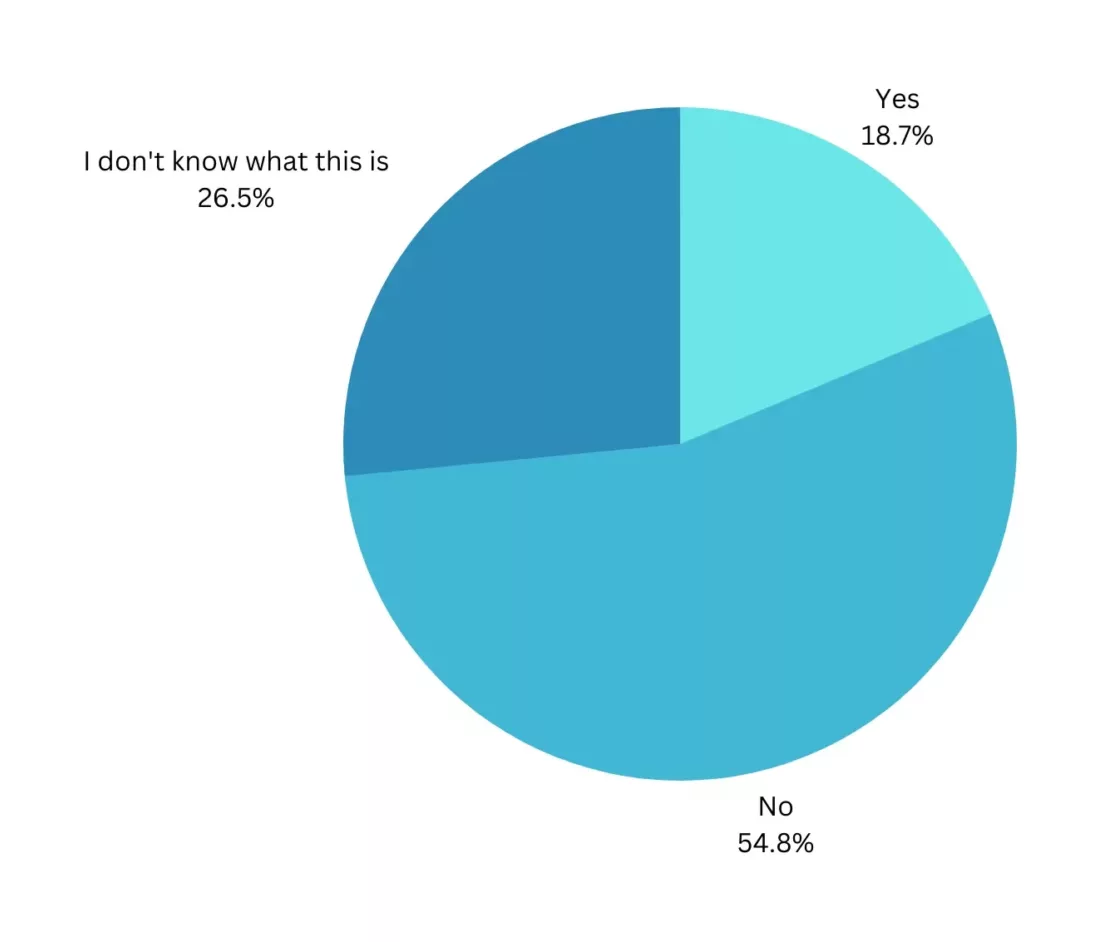
EPCs have developed leaps and bounds since they were introduced back in 2007. Traditionally numbered on a scale of 1-100, the higher the number, the more efficient the home was considered. Thanks to renewable technology, though, it became difficult for housebuilders and developers alike when a home was considered better than the scale. This often meant the eco credentials of a home were played down in order to fit on the EPC to avoid the extra work of going beyond the scaling system. Some online systems couldn’t cope with numbers in excess of 100, but now they can. A home with an EPC rating over 100 generates more energy than it uses thanks to the renewable systems it has in place. Almost 55% of UK homeowners were not aware of this information.
Almost 19% of UK homeowners are aware of how an EPC can exceed a rating of 100
Over ¼ of people weren’t sure of the details of an EPC
Breakdown by age
Findings
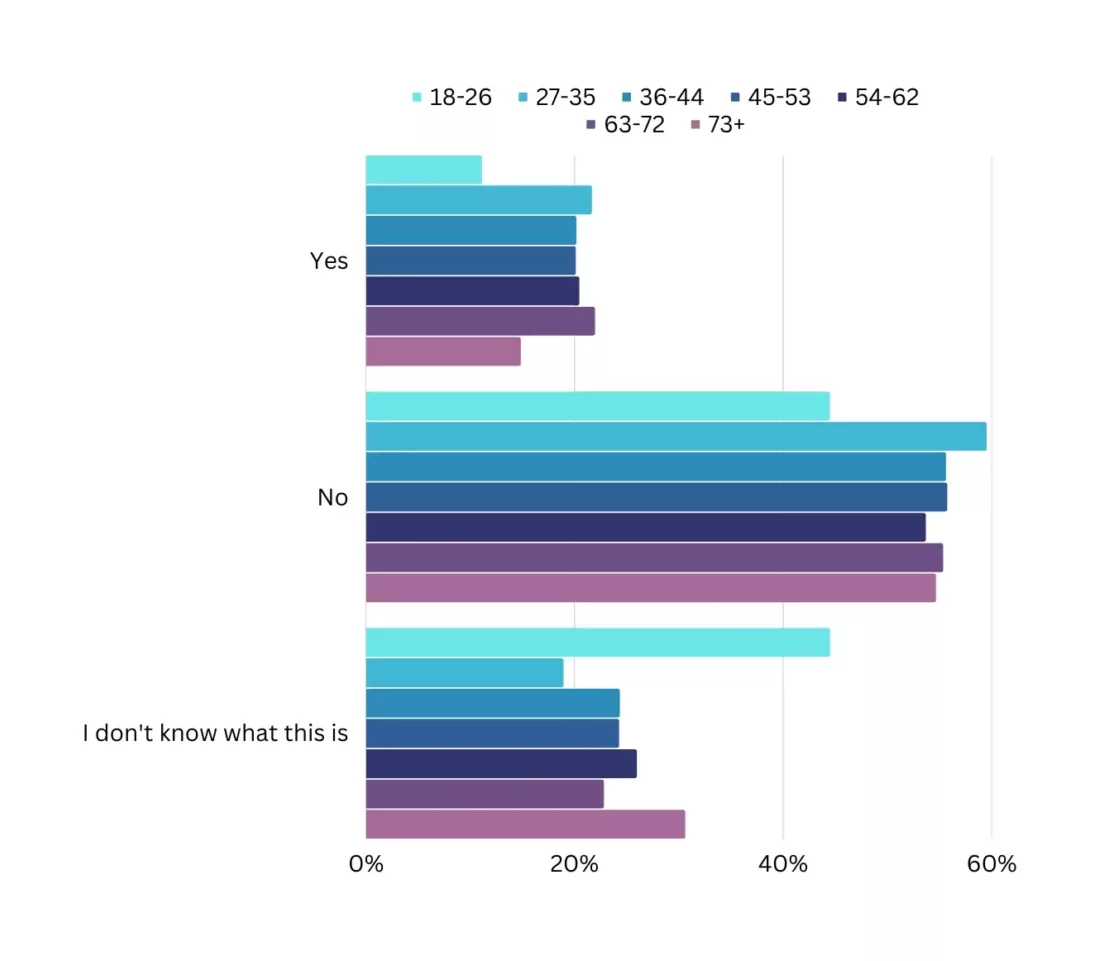
EPCs going over 100 is a relatively new concept, but this is understood by 27-35 and 63-72 year olds the most, at 22% each. An equal number of people don’t know what an EPC is, with 23% of 63-72 year olds unsure and 44% of 18-26 year olds the same. The levels of people who don’t know about EPCs exceeding 100 are fairly consistent across all age groups, with the highest percentage among 27-35 year olds at 59%.
22% of 27-35 year olds and 63-72 year olds know this
59% of 27-35 year olds aren’t aware
In 2025, gas boilers will be phased out of new builds. Will this affect your decision to replace your existing boiler?
Findings
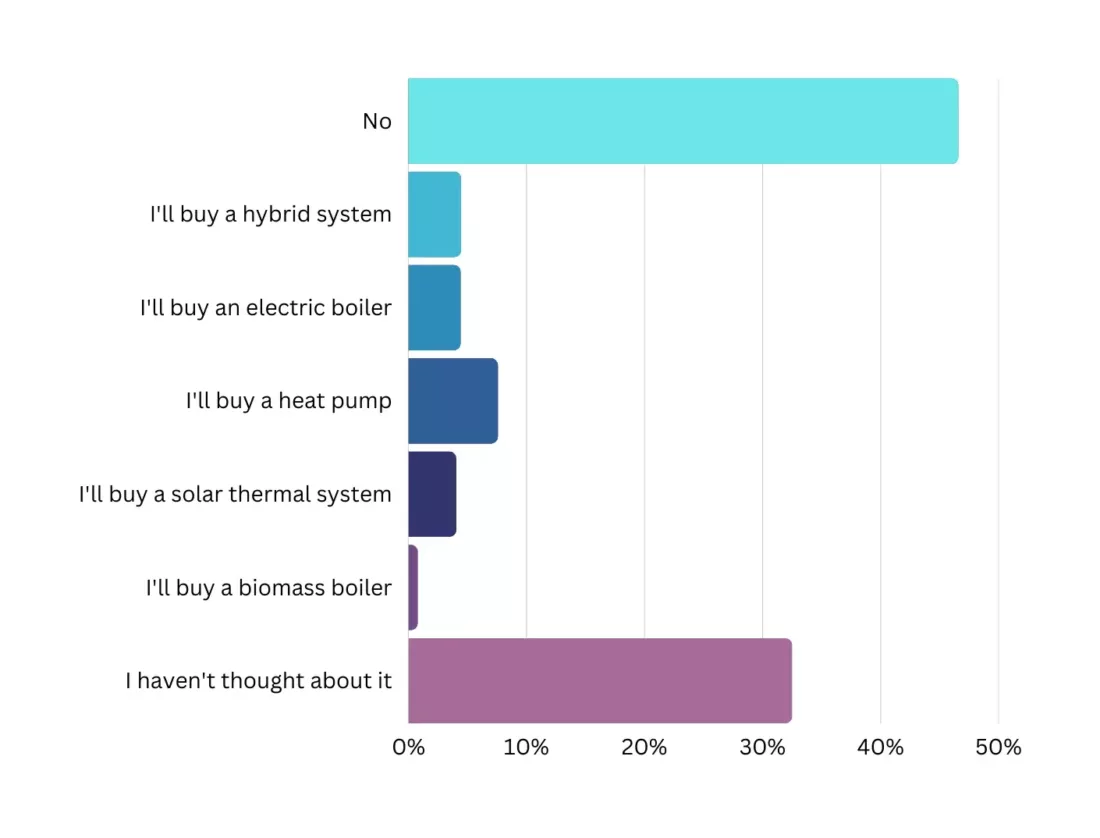
As part of the UK Government’s plan to net zero, gas boilers are going to be phased out of new builds in 2025. Instead, low carbon or electric alternatives will need to be installed. There is no plan to phase out existing gas boilers, but this shift could see a dramatic change in the cost of all heating systems as a result of shifting supply and demand. Despite this, almost ½ of UK homeowners won’t look to replace their existing boiler, with a further ⅓ not having thought about it. The potential uptake for low carbon technology was fairly level, with heat pumps coming out as the top replacement.
47% of people will not change their boiler after the gas boiler ban
Over 32% haven’t given it any thought
Less than 1% of UK homeowners would replace their existing boiler with a biomass boiler
Breakdown by age
Findings
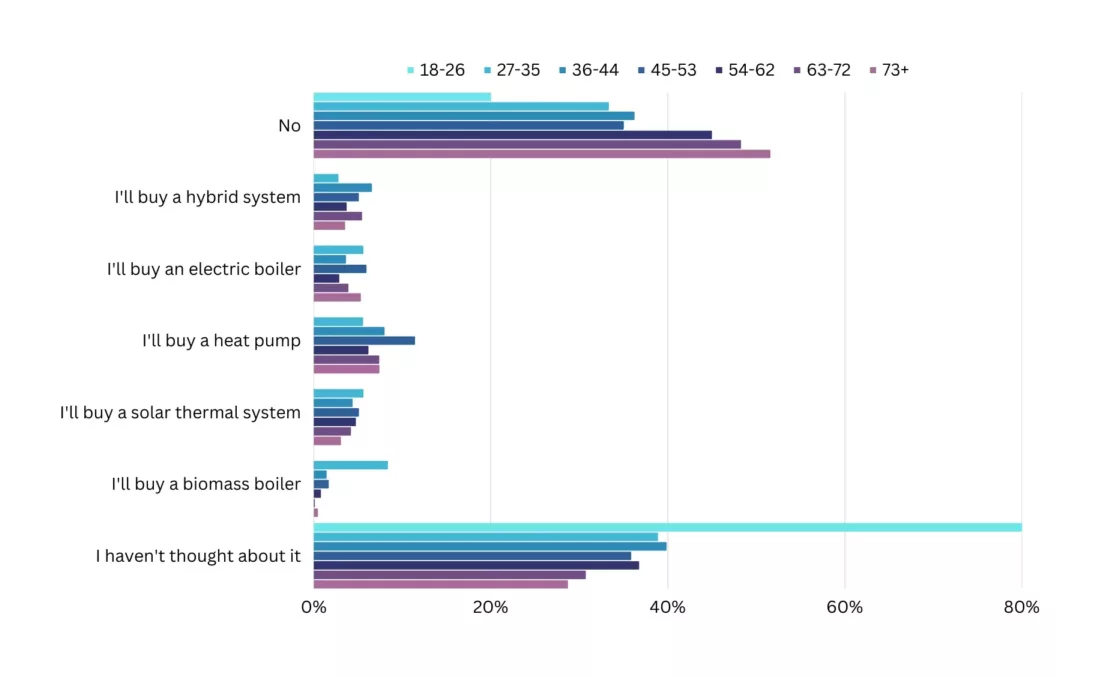
Phasing out gas boilers is a concept that has been around since 2019, but 80% of 18-26 year olds haven’t given it any thought, compared to around 35% for all other age groups. The older generations are less inclined to replace their gas boiler, with 51% of those aged 73+ not wanting to replace their system after the ban comes into effect.
18-26 year olds are the least affected by this issue, either not wanting to replace their system or not having thought about it. Alternative systems most in favour are heat pumps, with an approval rating of 11% in 45-53 year olds.
51% of people aged 73+ will not change their boiler after the gas boiler ban
Less than 1% of 63-72 year olds want to replace their system with a biomass boiler
Cost of Living and Energy Crises
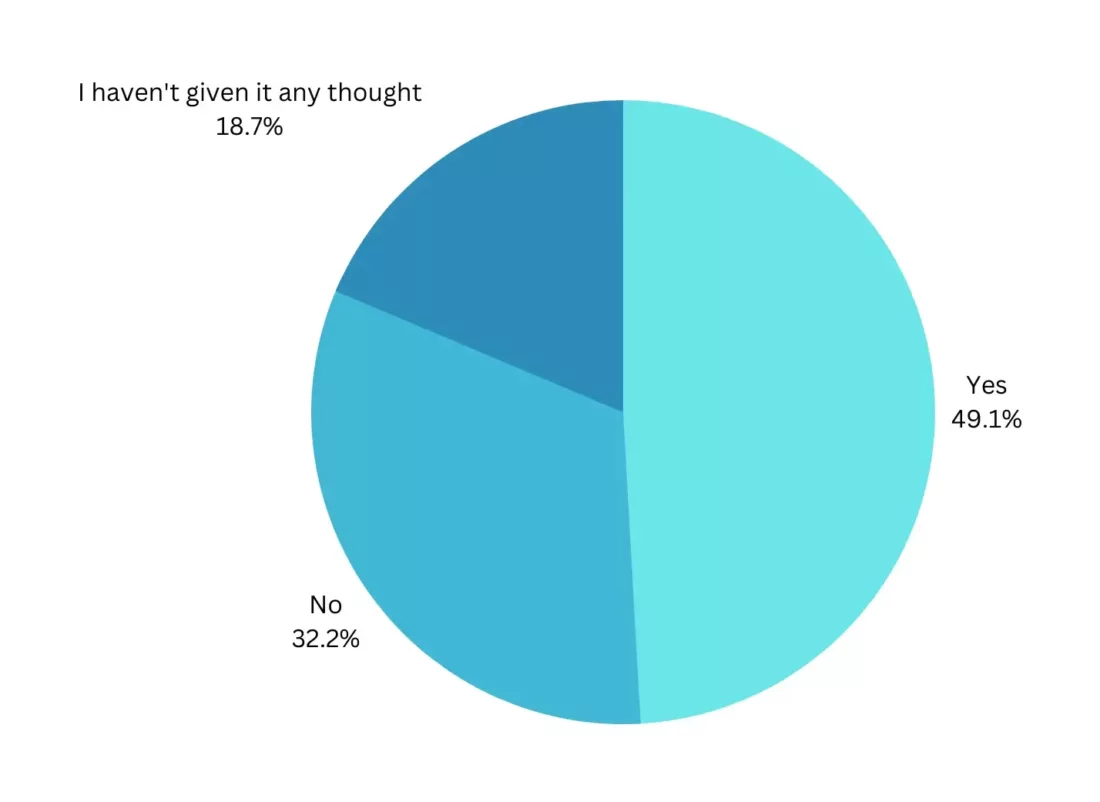
Due to the cost of living crisis, the energy crisis and rising inflation, are you thinking about purchasing a low carbon technology to lower your household bills?
Findings
Low carbon technology is cheaper to run and can save you money off your energy bills. Despite the massive upfront cost, you can save money straight away, which gives you more freedom from other daily costs. With prices mounting on all sides, households have cut back on their spending. Almost ⅓ of UK households have not thought about reducing their energy bills with low carbon technology, while almost 50% have.
A little over 49% of UK homeowners have thought about using low carbon technology to reduce their bills
Almost 20% of people have not given this any thought
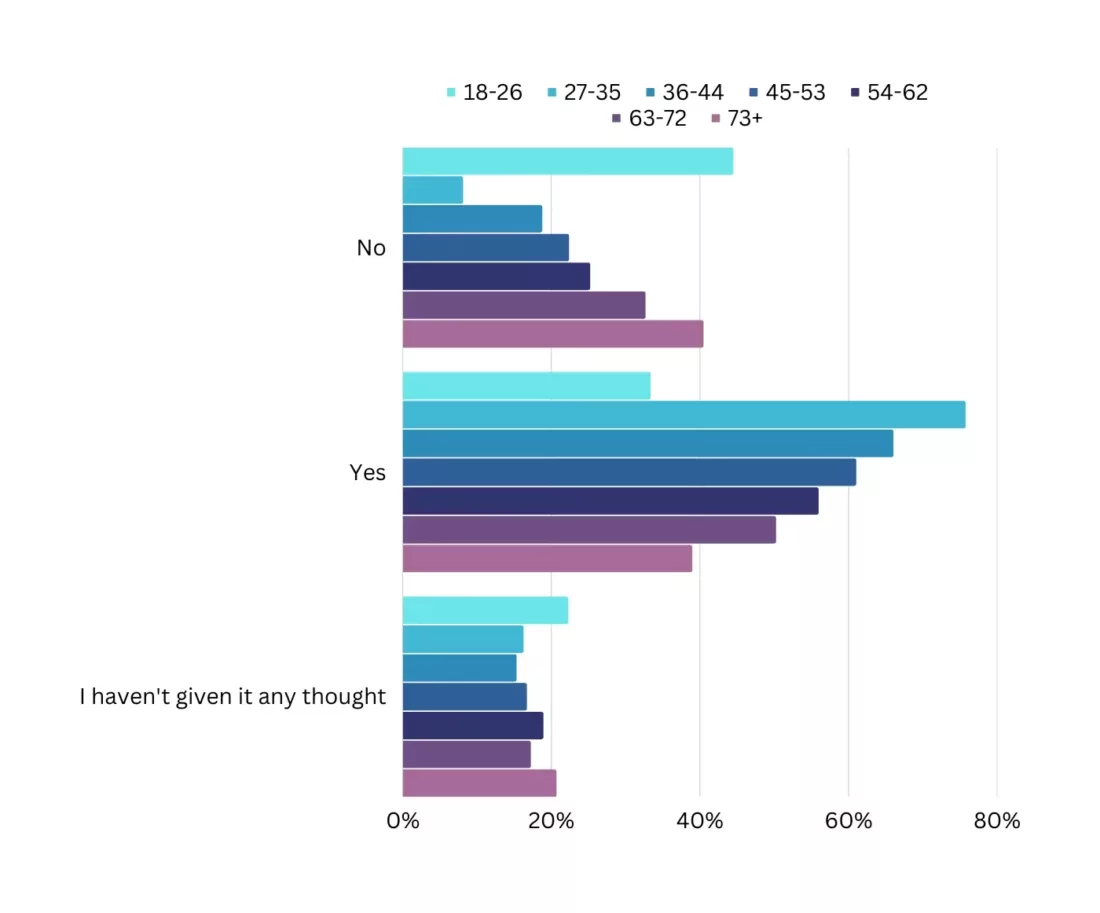
Breakdown by age
Findings
It’s well known that low carbon technology can lower your energy bills, but with only 49% of people thinking of doing this as a result of rising costs elsewhere, the biggest advocates are people aged 27-35 at 76%. 40% of those aged 73+ are not thinking of purchasing low carbon technology to reduce energy bills at the moment, which is double the percentage of them who haven’t given it any thought.
Only 8% of 27-35 year olds are not thinking to reduce their energy bills this way, while 44% of 18-26 year olds feel the same. As cost is the biggest factor, we can easily understand why it’s not in the minds of the youngest generation so much.
76% of 27-35 year olds have thought about purchasing low carbon technology to reduce their energy bills
15% of 36-44 year olds haven’t given this any thought
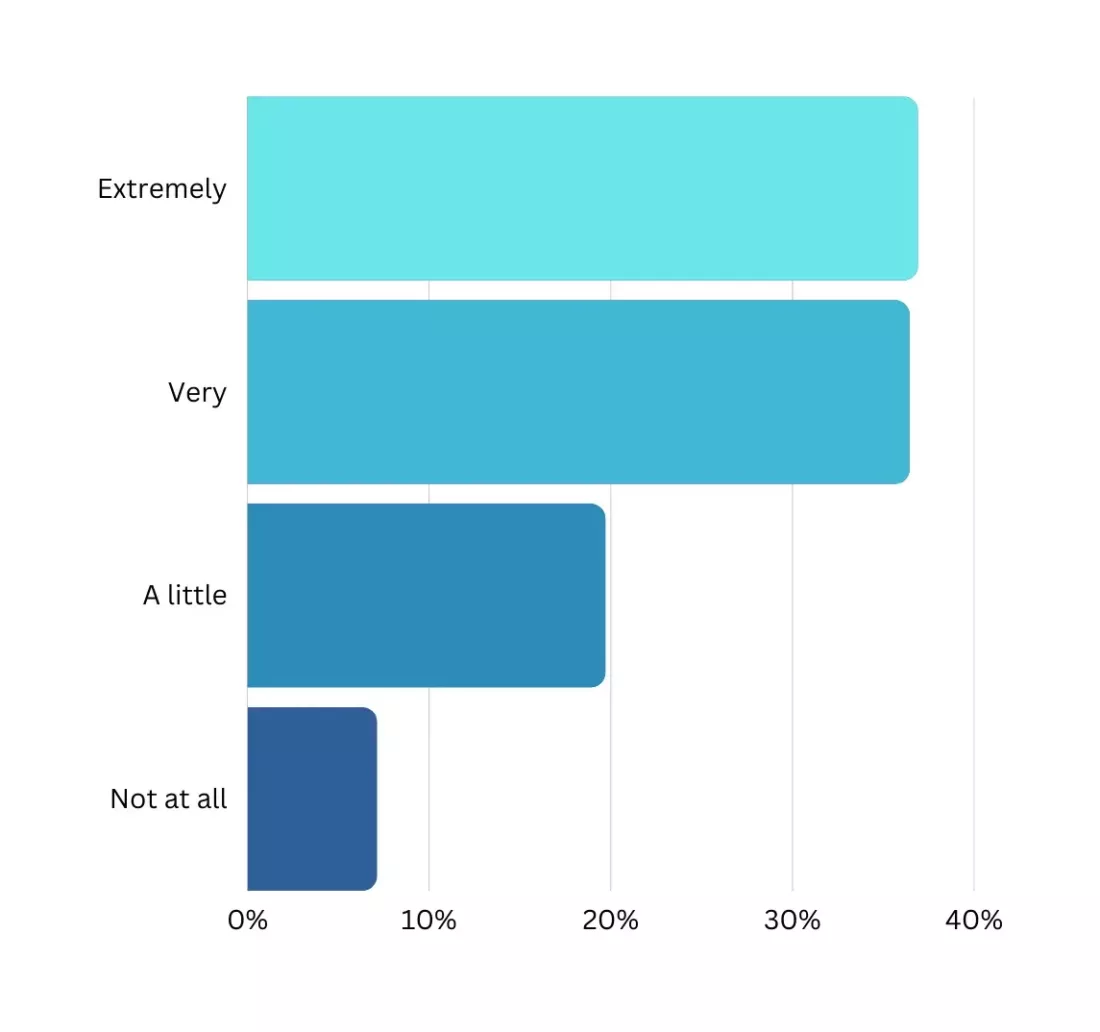
How worried are you about climate change?
Findings
Understanding the attitudes of the public is key when it comes to big issues. It’s not simply a case of allowing the government to shape the future direction of the climate without any input from those they are presiding over. As scientists and researchers were voted as the most trustworthy group of people, it’s clear from these results that more and more people are listening to them, even if individuals in the government are not. Nowadays, you can’t go anywhere without thinking about climate change in some way, shape or form. This is why almost ¾ of UK households are worried by climate change to some degree, with 37% being extremely worried.
37% of people are extremely worried about climate change
Only 7% of UK homeowners are not worried at all
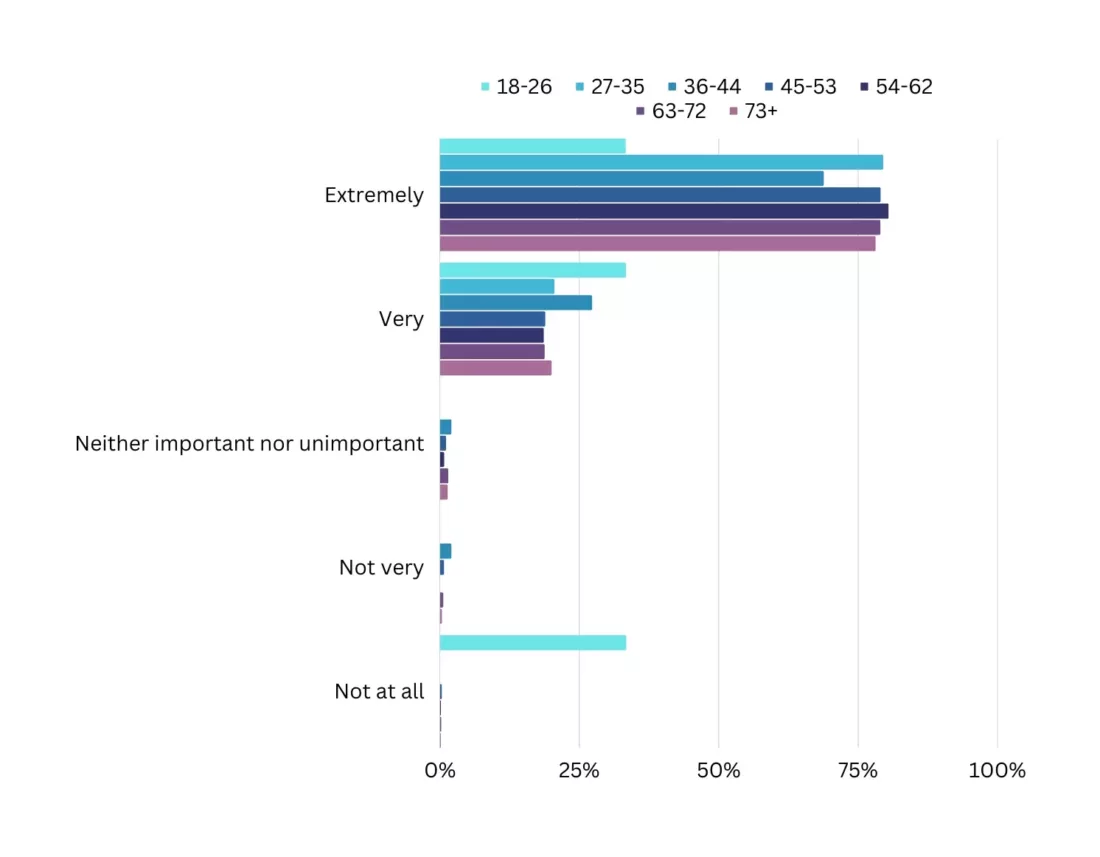
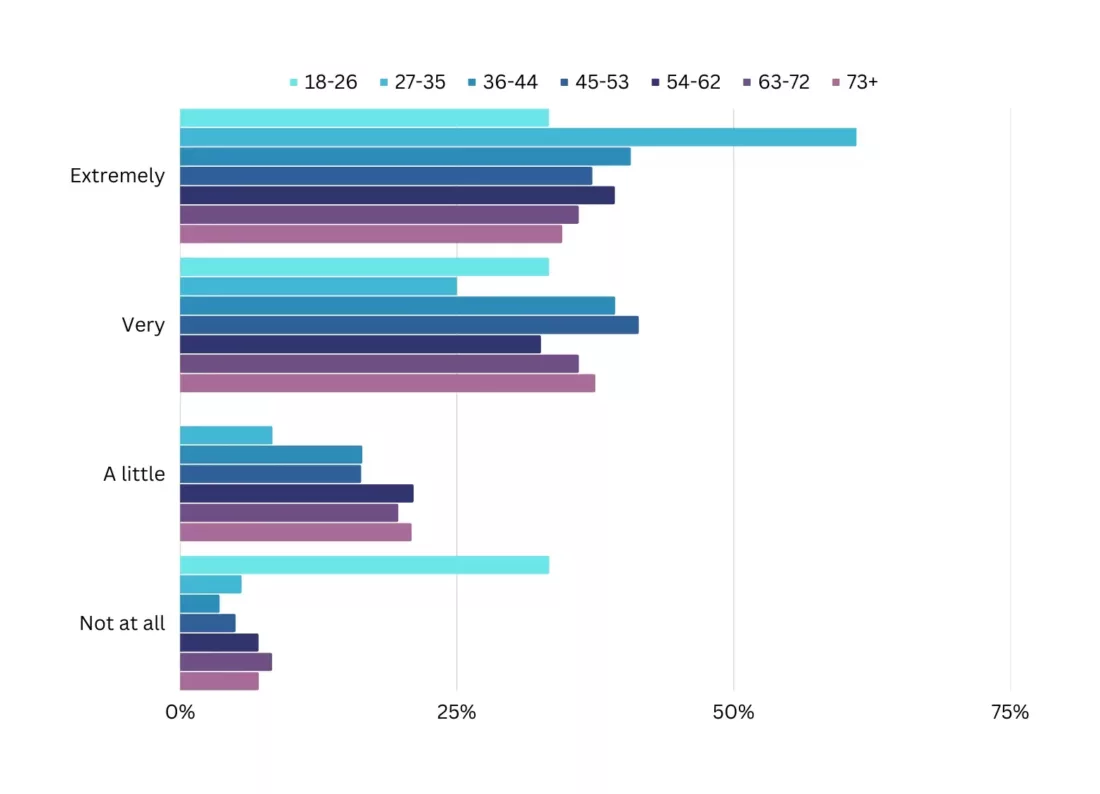
Breakdown by age
Findings
More 27-35 year olds are extremely worried about climate change than any other age group, with 61% saying so. All other age groups are fairly consistent, at around 35%. Of those very worried, the 45-53 year olds came out on top at 41%. All other age groups are similar, except for 27-35 year olds, who are even more worried than this.
Of those age groups with the least concern for climate change, 3% of 36-44 year olds are not worried at all, compared to 33% of 18-26 year olds. 21% of 54-62 year olds are only a little worried about climate change, but no 18-26 year old is only a little worried.
61% of 27-35 year olds are extremely worried about climate change
3% of 36-44 year olds are not worried at all
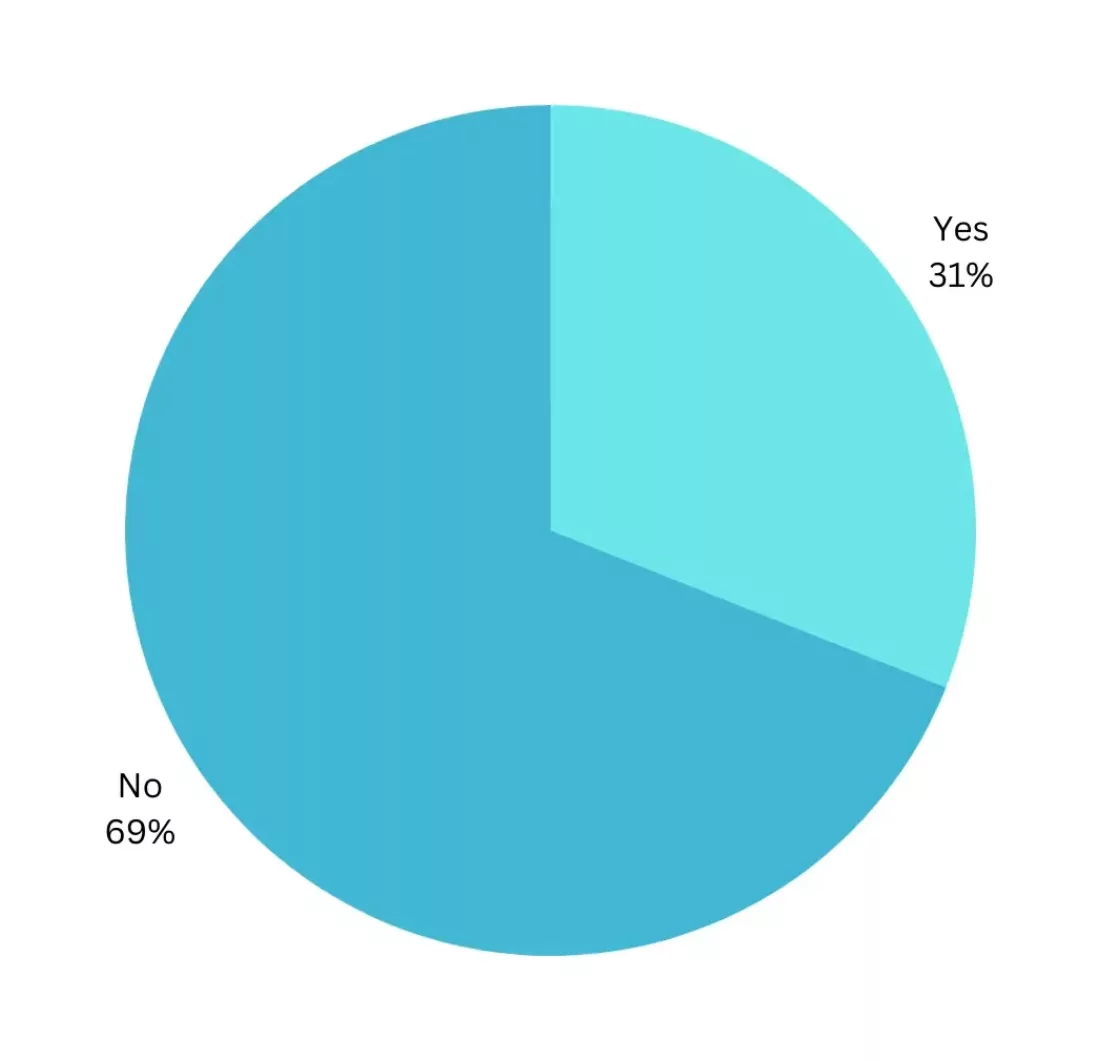
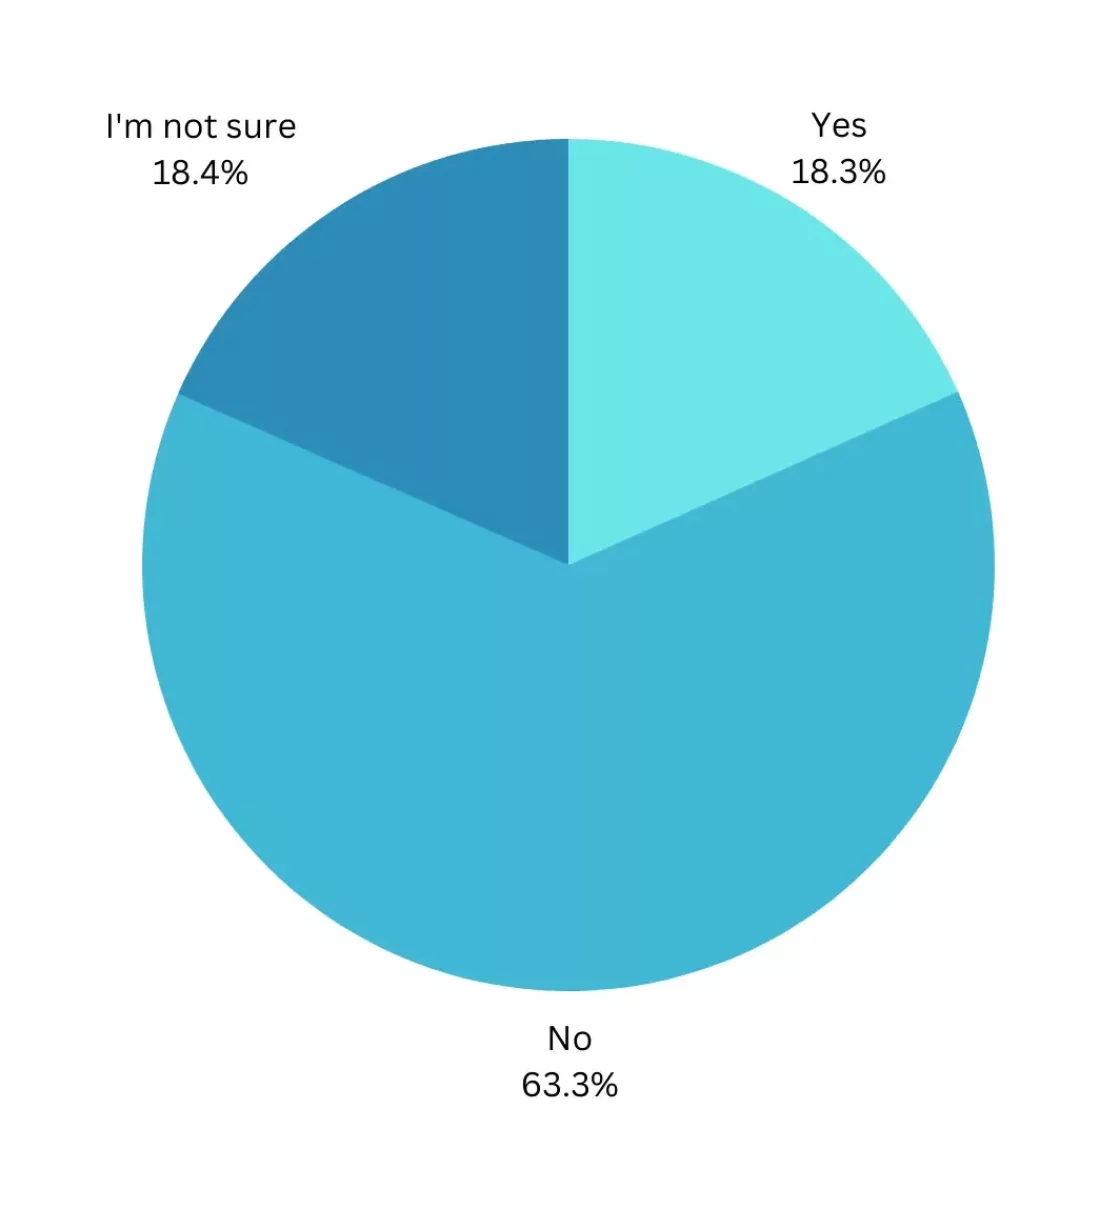
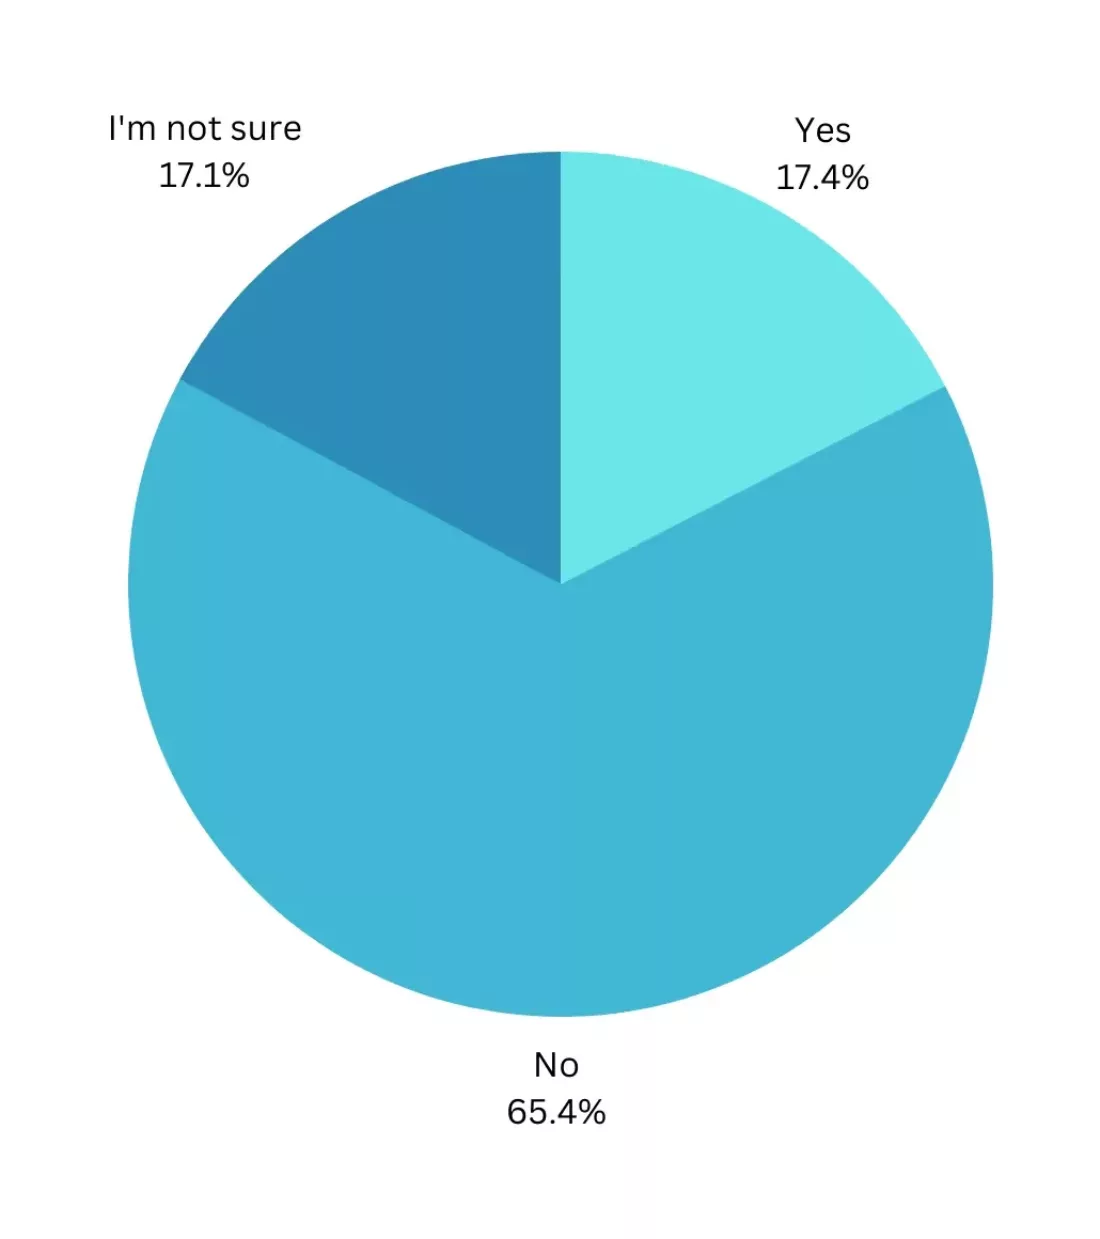
Do you think the government is doing enough to combat climate change?
Findings
Climate activists have been on the news throughout the year, whether it’s been Extinction Rebellion, Just Stop Oil or otherwise, impacting the lives of the public more so than the policymakers who are accused of inaction. Government policy has seemed to be going in the wrong direction when it comes to combating climate change. When Liz Truss stopped King Charles from attending COP27, Rishi Sunak didn’t overturn this decision when he succeeded her. He also wasn’t going to COP27 until the 11th hour. Likewise, Sunak hadn’t given the go ahead for onshore wind farms until another characteristic U-turn in late November. Due to all of this and more, a massive 63% of UK homeowners do not believe the government is doing enough to combat climate change, while over 18% were unsure.
A little over 63% of people don’t believe the government is doing enough about climate change
Only under ⅕ of UK homeowners believe the government is doing enough to combat climate change
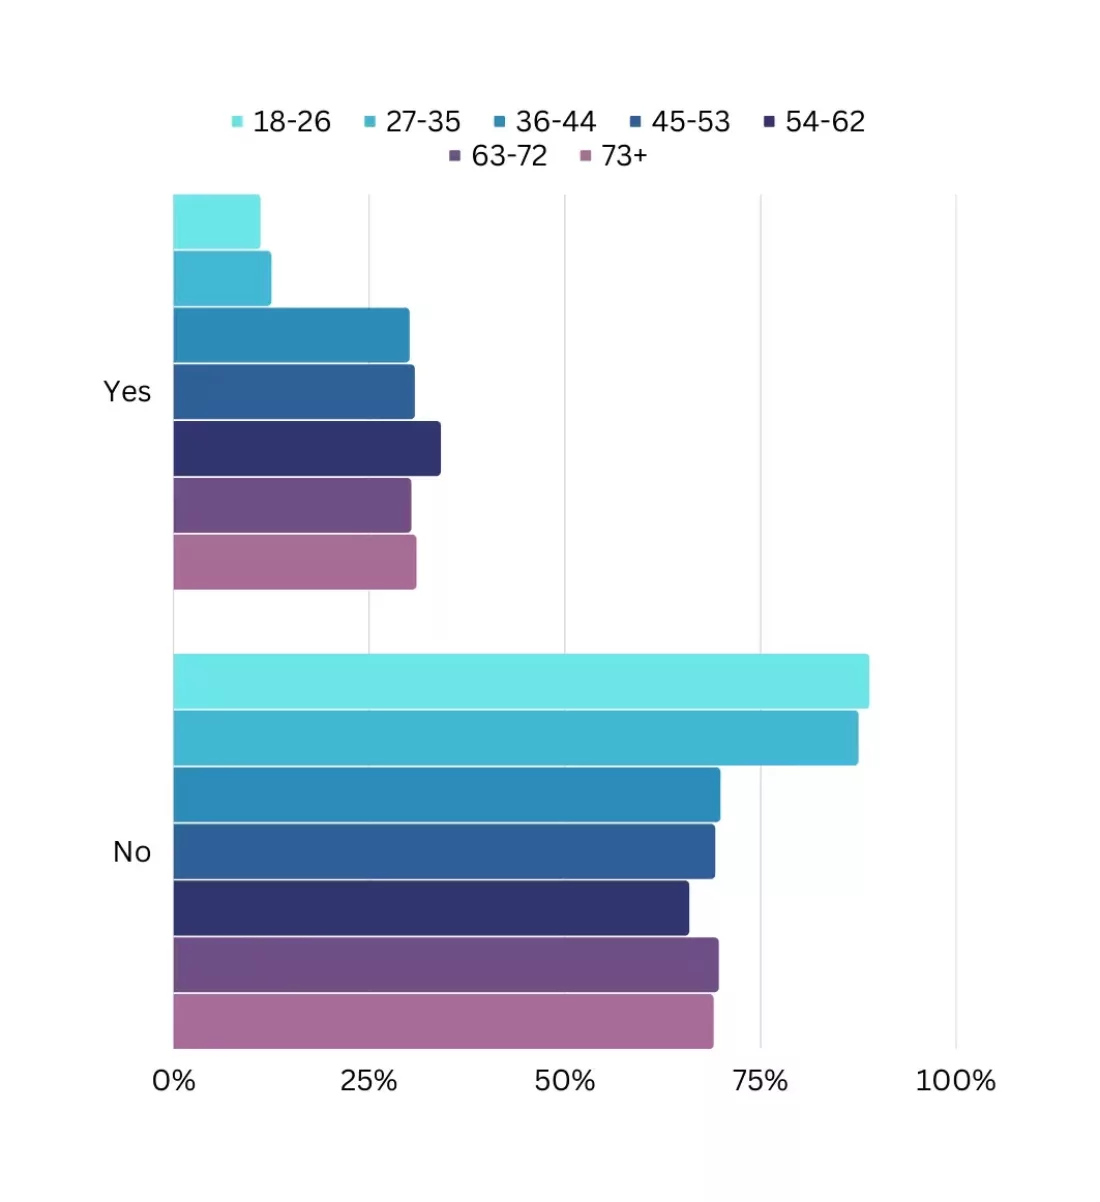
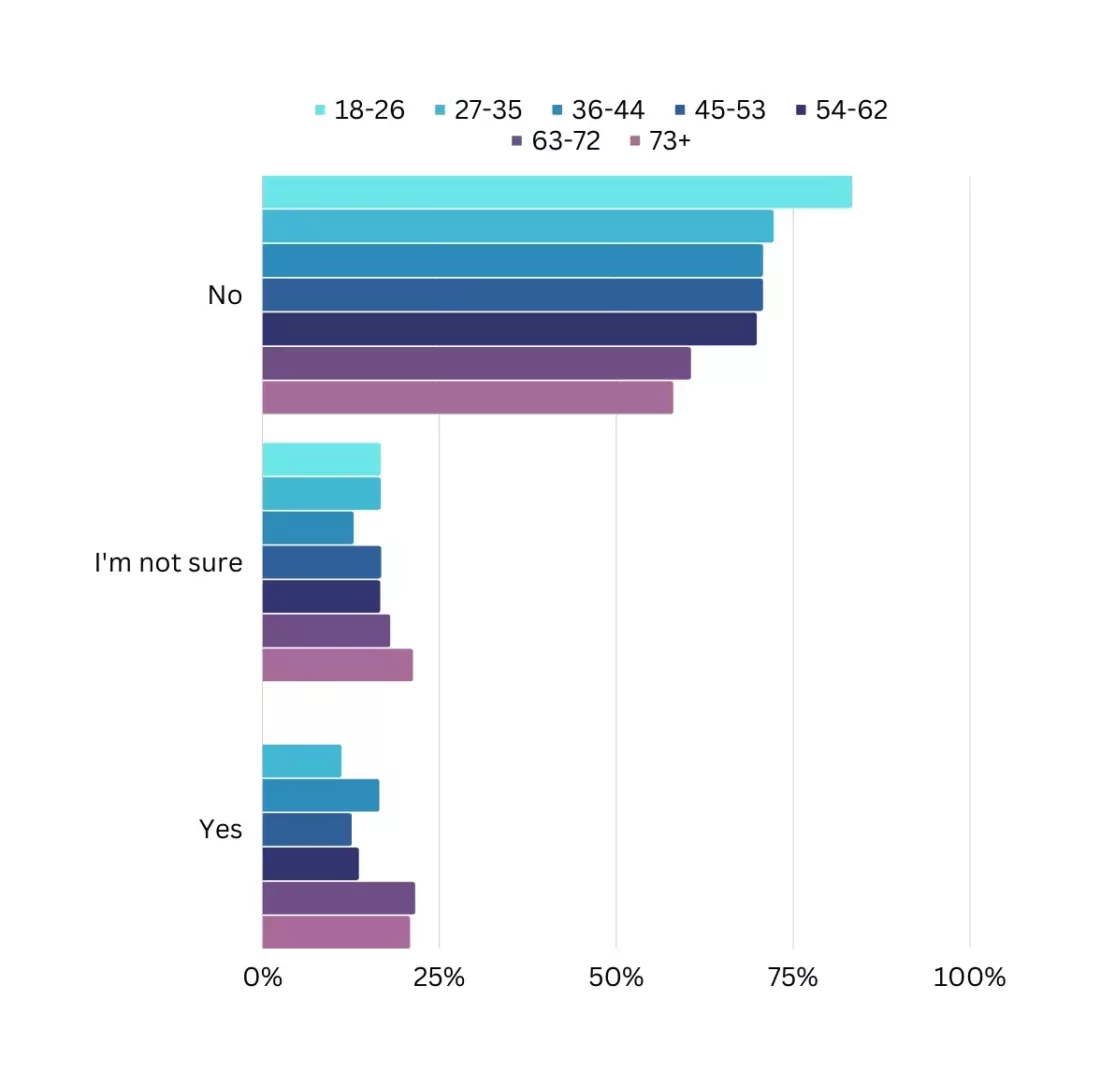
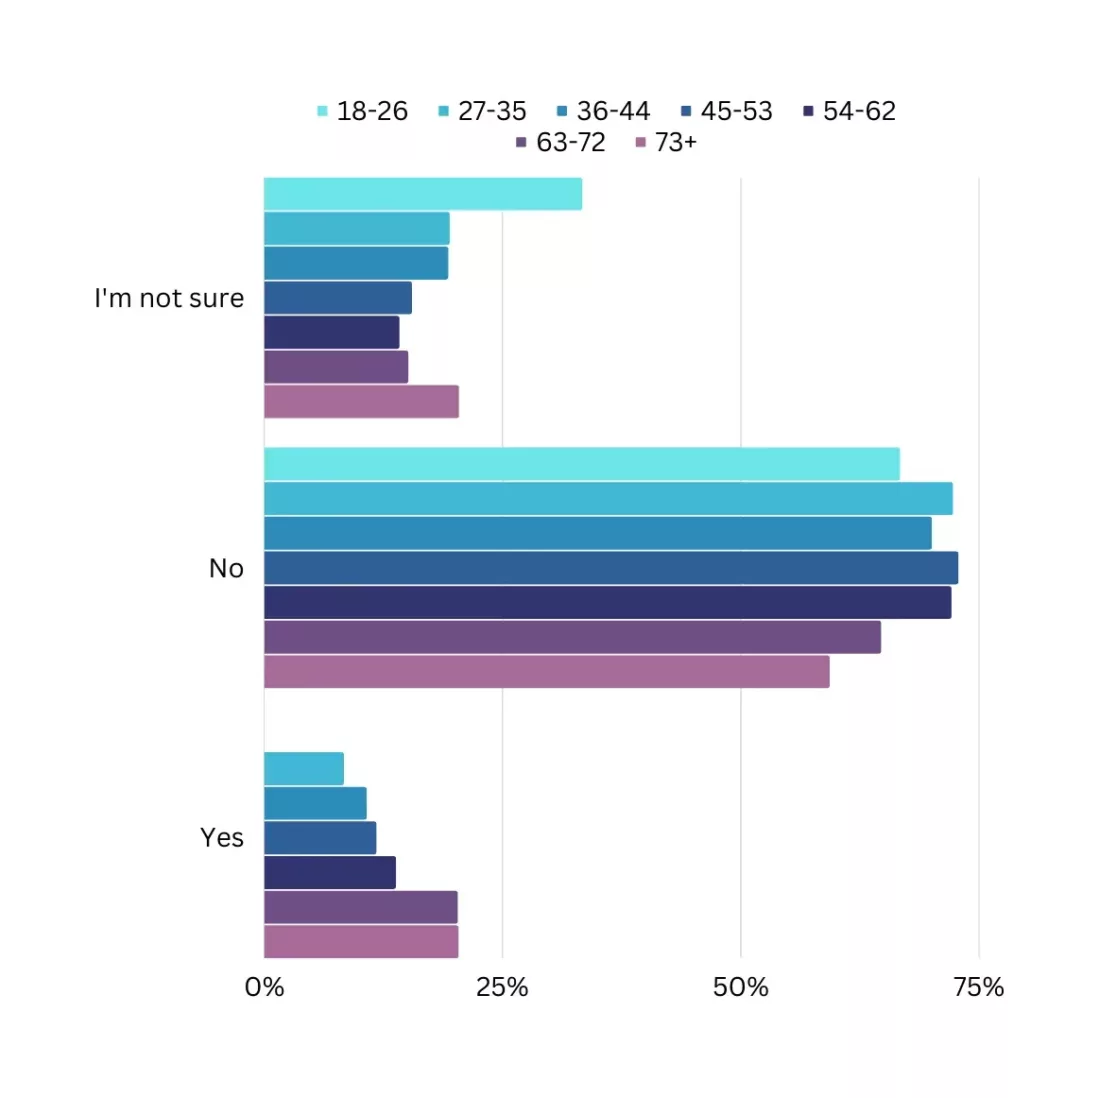
Breakdown by age
Findings
The results are fairly consistent across all age groups, with no 18-26 year old believing the government is doing enough to combat climate change. 83% of 18-26 year olds are not behind the government’s climate change policies, while 21% of 63-72 year olds are. People aged 73+ are the most unsure group, at 21%, but 58% of this age group also don’t believe the government is doing enough.
83% of 18-26 year olds do not believe the government is doing enough to tackle climate change
21% of 63-72 year olds are happy with the government’s climate achievements
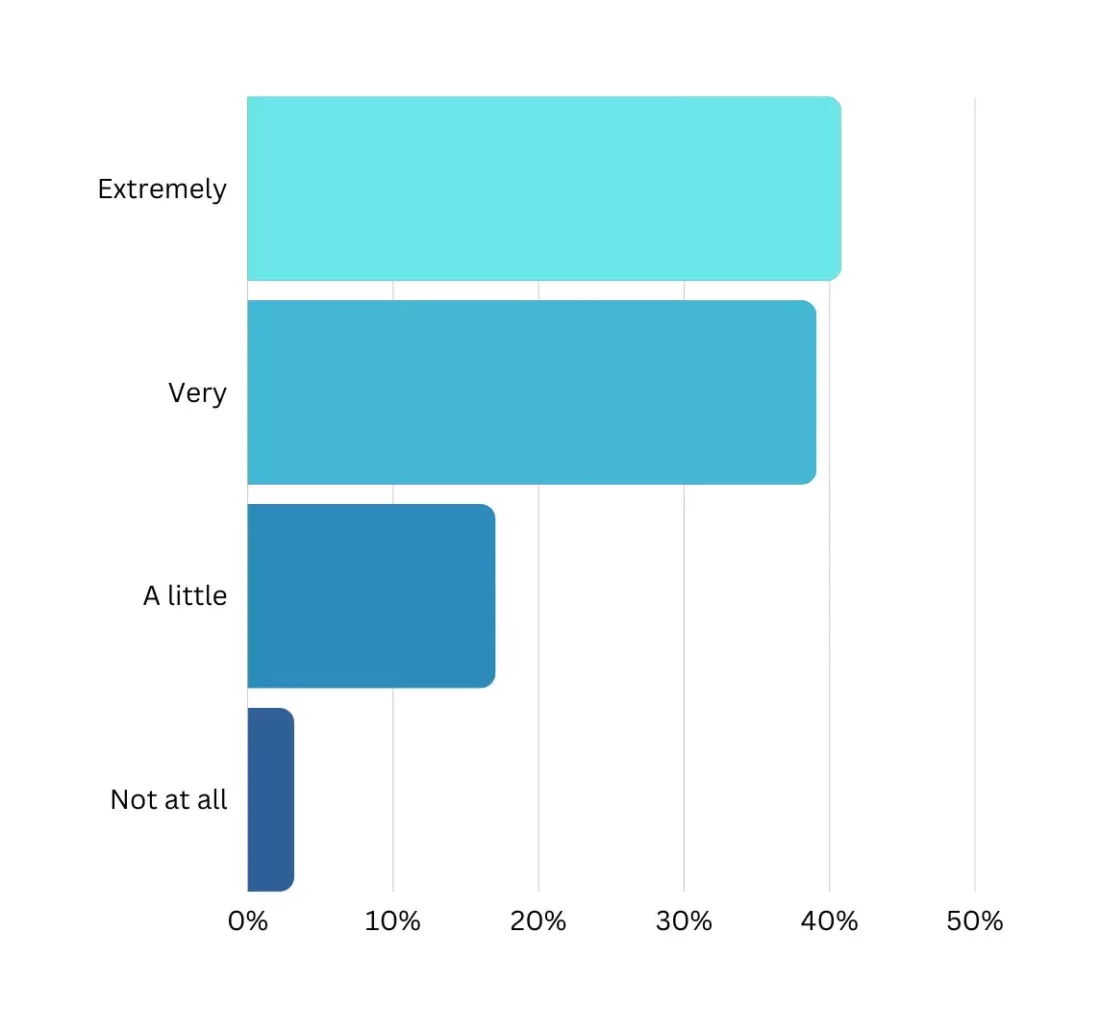
How worried are you about the energy crisis?
Findings
Before the Energy Price Guarantee was introduced under Liz Truss in October, predictions for Ofgem price cap increases were putting energy bills at eye-watering levels of almost £6,000 by April 2023. Despite the EPG being implemented, energy bills still rose an average of 27%. Russia’s war with Ukraine has rocketed energy prices as European gas supplies have been impacted, highlighting just how much we rely on them. Before this, energy prices were impacted by the end of the pandemic as normal life resumed, spiking demand. With so much discourse surrounding the energy crisis, it’s no wonder that almost ⅘ of UK homeowners are either extremely or very worried about the energy crisis. If we add those who are only a little worried, this brings the total of worried UK homeowners to 97%.
Over 40% of people are extremely worried about the energy crisis
Only 3% of UK people are not worried about the energy crisis at all
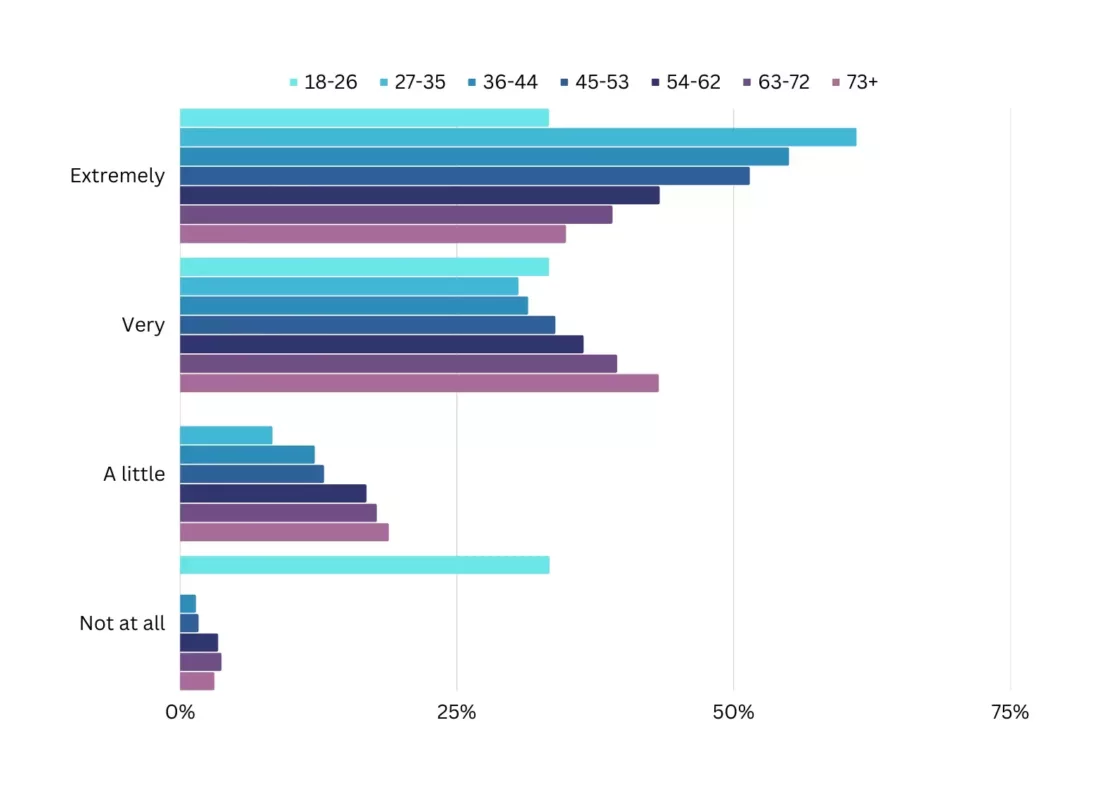
Breakdown by age
Findings
The level of worry over the energy crisis is almost fairly level between all ages. The most worried are 27-35 year olds at 61%, compared to just 33% of 18-26 year olds. Those very worried about it are people aged 73+ at 43%, compared to 30% of 27-35 year olds. Working families are more concerned about feeding their children and keeping the heating on than the older generation.
Only between 2-3% of most ages are not at all worried about the energy crisis, but over 33% of 18-26 year olds are. The most concerned age group is those aged between 27-35, with none of them unconcerned about the energy crisis at all.
61% of 27-35 year olds are extremely worried about the energy crisis
19% of those aged 73+ are only a little worried
Do you feel as though the government is doing enough about the energy crisis?
Findings
Separating out the energy crisis from the cost of living crisis is crucial in understanding the attitudes of where government policy is considered to be effective in the eyes of the public. However, similar percentages can be seen between the two questions. Liz Truss was quick to repeatedly point out her intervention with the Energy Price Guarantee, but before this the Energy Bills Support Scheme was announced which gives a non-repayable £400 to homeowners between October 2022 and March 2023. The Energy Bill Relief Scheme was set up to help charities and businesses as well. Despite this, some feel as though the support has not been enough and the focus on establishing more renewable energy generation could have alleviated some of the pressure, seeing as renewables are 9 times cheaper than gas. Perhaps this is why a little over 65% of UK homeowners do not believe the government is doing enough, with a further 17% unsure.
Over 65% of people don’t believe the government is doing enough
A little over 17% of UK householders believe the government is doing enough to tackle the energy crisis
Breakdown by age
Findings
65% of people don’t believe the government is doing enough, with the biggest believers of this in people aged 45-53, at 73%. People aged 73+ are more lenient at 59%, but between 15% and 33% of all ages are unsure. Only 8% of 27-35 year olds believe the government is currently doing enough.
73% of 45-53 year olds do not believe the government is doing enough about the energy crisis
8% of 27-35 year olds are happy with what the government is currently doing
Energy Security
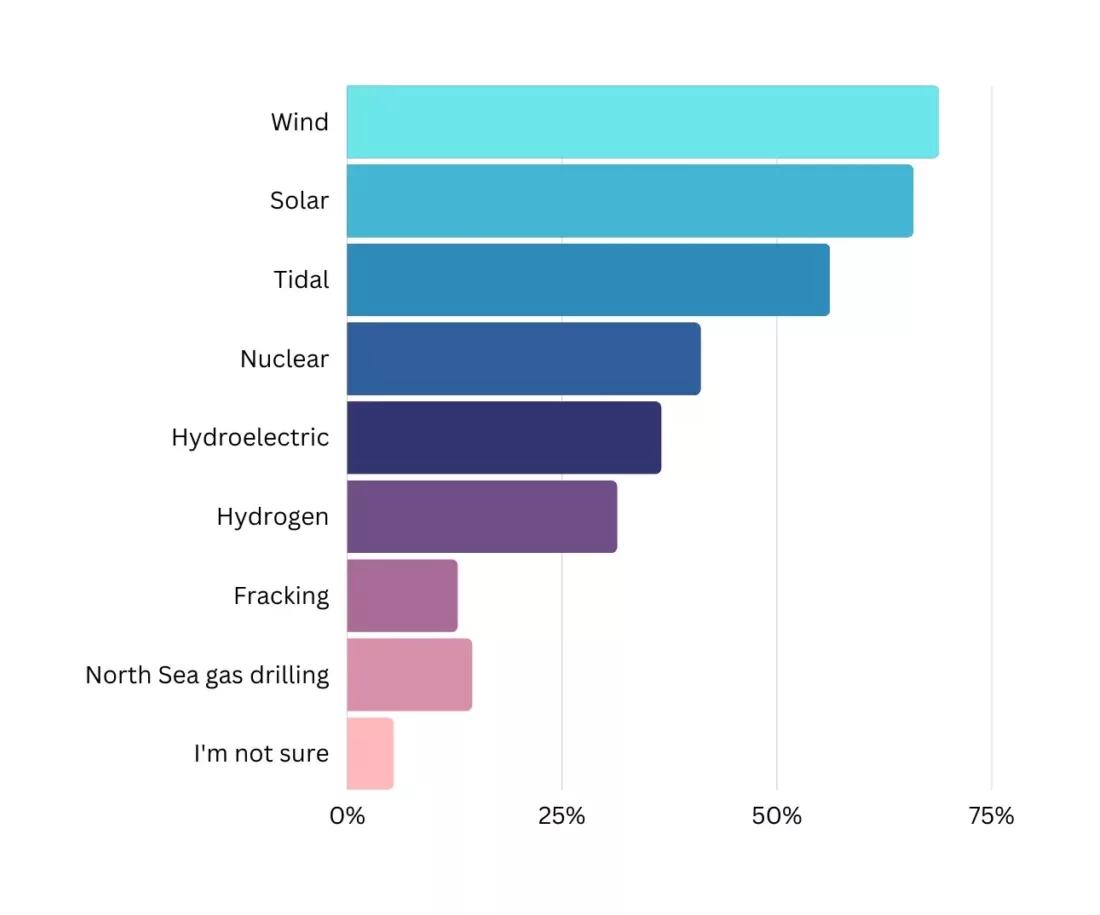
In order to keep energy bills low, it’s important to have self-reliance when it comes to generating energy. Where do you think the UK should invest to reduce the amount of electricity and gas we import from other countries?
Findings
Energy security is a hot topic at the moment, not least because of the energy crisis we’re currently facing. Because of our dependence on importing energy from Europe, we’ve had fears of planned blackouts across the UK over winter in a worst-case scenario from National Grid. Making sure that we have the infrastructure in place to generate our own electricity and be able to store it in times of low use is paramount in reducing the amount we pay for our energy. Renewable energy from solar, wind and tidal has the highest backing of 62.5%, according to UK homeowners, with nuclear, hydroelectric and hydrogen following. Despite hydrogen being written off by scientists earlier this year as a viable solution for domestic energy needs, it still has a backing of almost ⅓ of UK homeowners.
68% of people want to invest more in wind power
66% want more solar energy
56% wish to see more investment in tidal power
Only 13% of UK homeowners are in favour of fracking
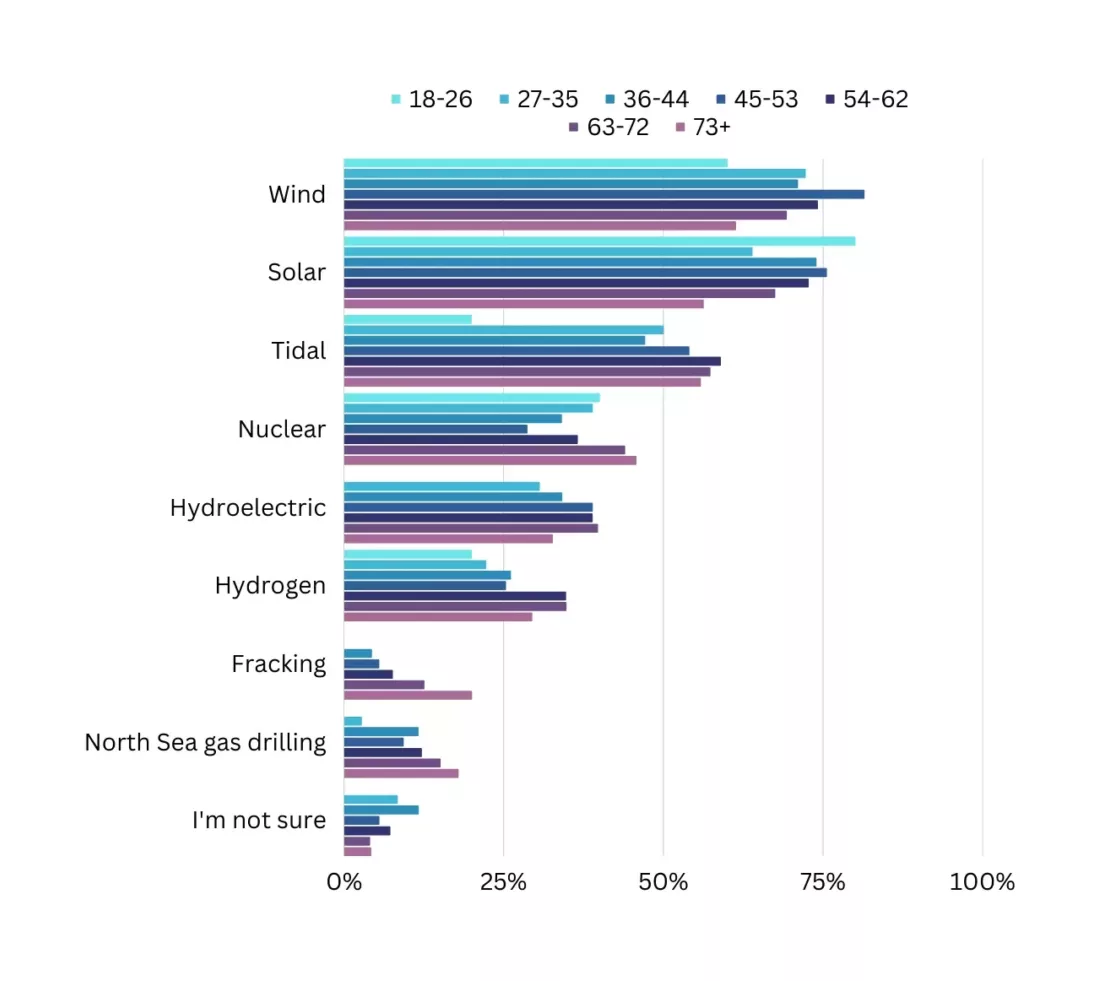
Breakdown by age
Findings
The advocacies for green energy solutions are roughly consistent across all age ranges, with 81% of 45-53 year olds the biggest believers in wind power and 80% of 18-26 year olds in solar power. Tidal power is most wanted by 59% of 54-62 year olds, compared to just 20% of 18-26 year olds.
Fracking is not on the minds of 18-35 year olds, but 20% of people aged 73+ believe we need to invest in it more. North Sea gas drilling is preferred by the older generations. Nuclear power, which produces toxic nuclear waste, is wanted by 46% of those aged 73+ and 29% of 45-53 year olds.
81% of 45-53 year olds wish to see more wind power
No 18-35 year old wants to see fracking in the UK
Shell alone has made a record-breaking $30 billion in profit this year. Do you think that the government should implement further windfall taxes against oil and gas giants as a result of never-before-seen profits?
Findings
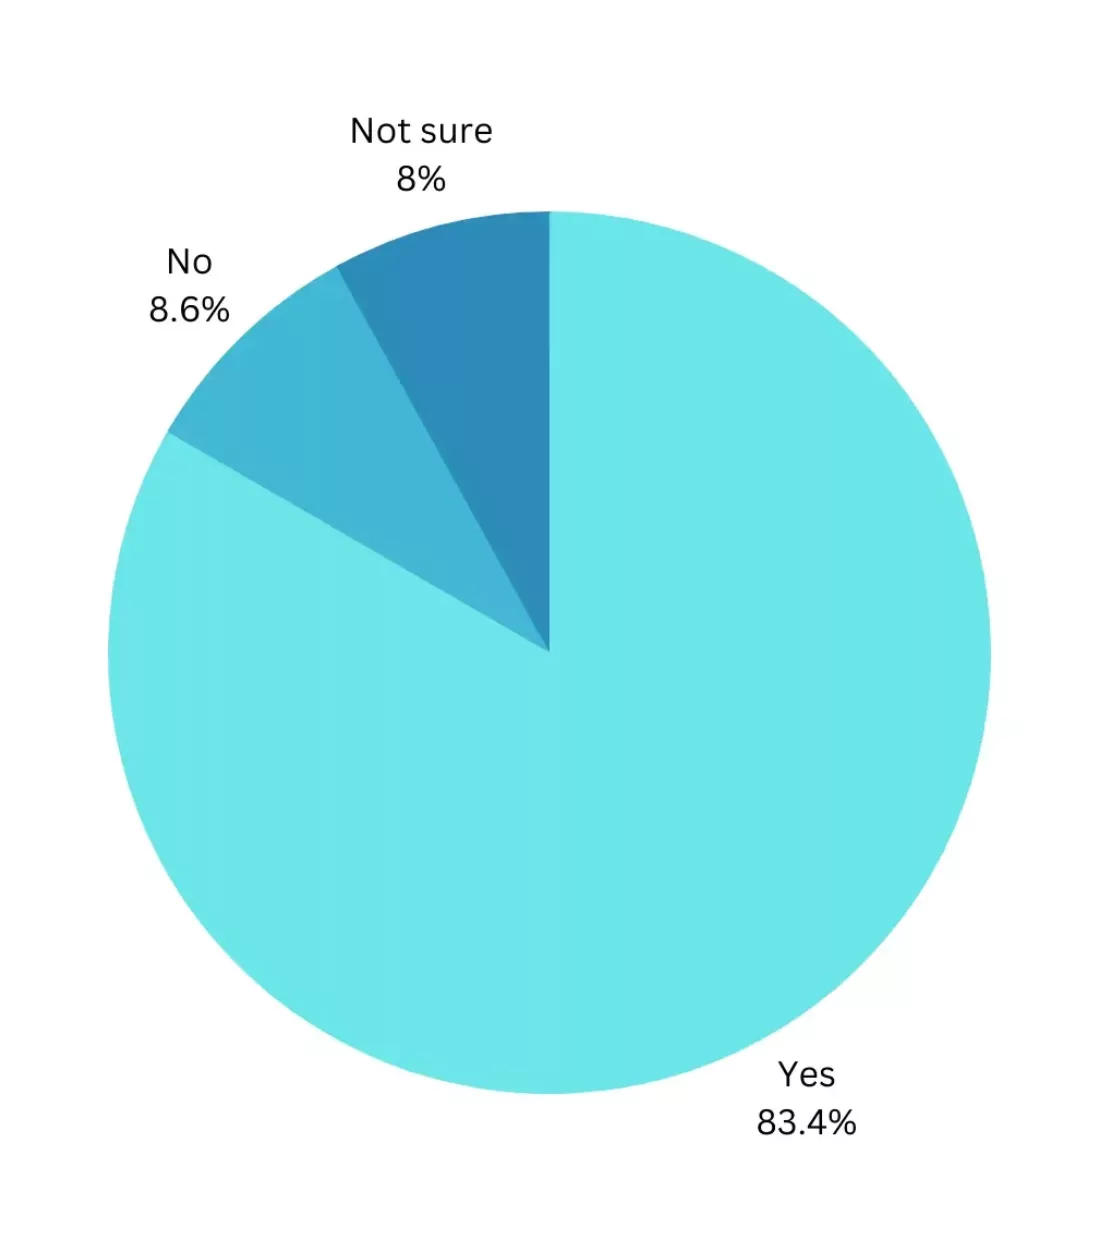
Oil and gas giants have been profiteering off the energy crisis and the soaring costs of petrol and diesel. Rishi Sunak implemented a £5 billion windfall tax on energy companies back in May when he was chancellor, which went part way to funding the measures to ease the cost of living burden. Jeremy Hunt has now increased the Energy Profits Levy, as it’s otherwise known, from 25% to 35% from January 2023. This will carry on until 2028 and is estimated to raise £40 billion. This, however, doesn’t stop oil and gas giants from claiming a tax relief of 91% for every pound spent on fossil fuel extraction within the UK. It’s no wonder that the public is angry at these record-breaking profits when 72% of UK homeowners have cut back on their energy use, and even less of a wonder that further windfall taxes have over an 83% approval rating. 8% of people were unsure.
Over 83% of people want to see more windfall taxes against oil and gas giants
Almost 9% of UK homeowners are opposed to windfall taxes against oil and gas giants
Breakdown by age
Findings
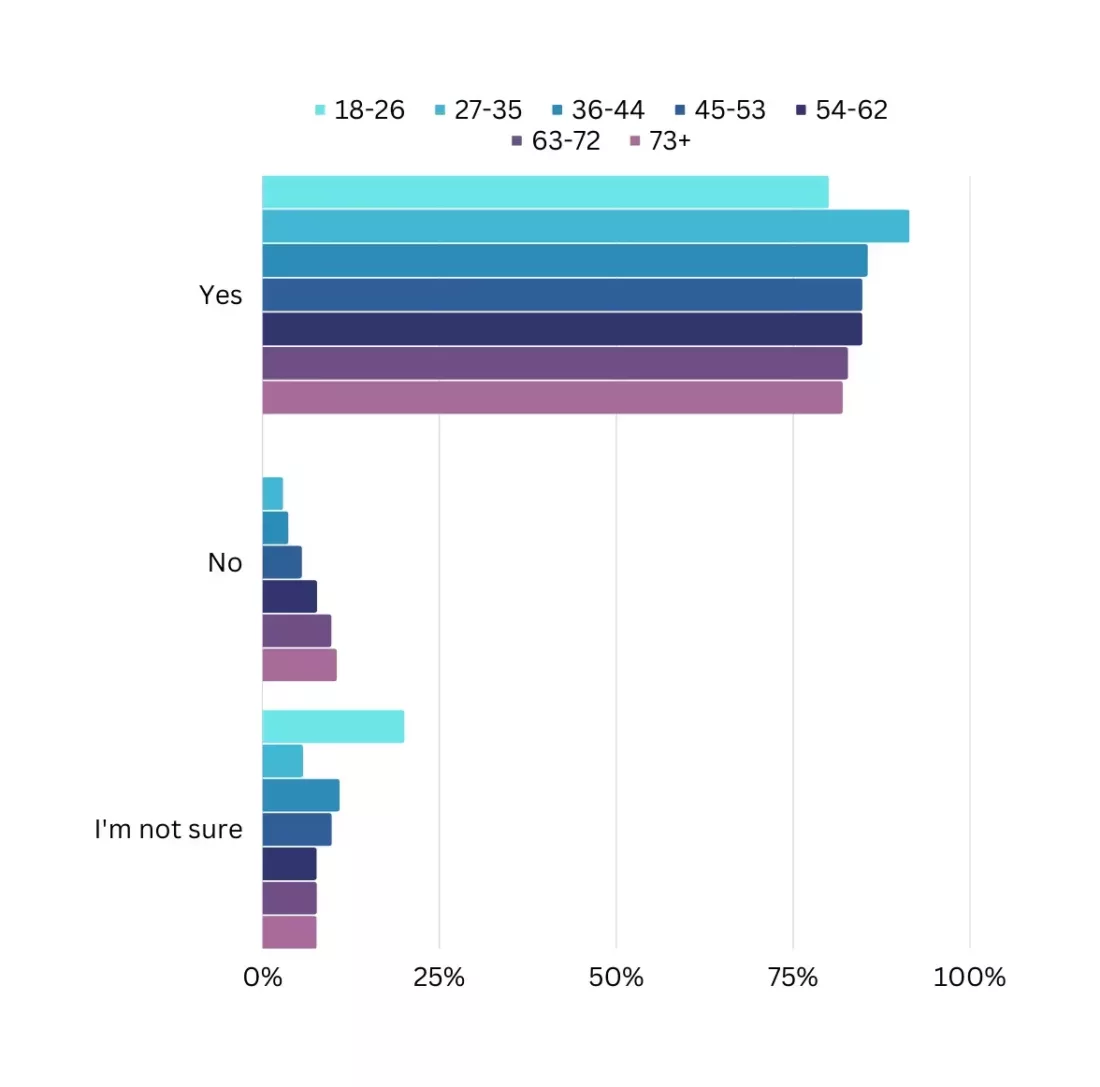
All age groups are roughly equal in wanting to see more windfall taxes against oil and gas giants. A staggering 91% of 27-35 year olds are all for more windfall taxes in the wake of these excessive profits, with no 18-26 year old believing it’s the wrong thing to do. Only people aged 73+ think that we shouldn’t implement more windfall taxes the most, compared to any other generation, at 10%; the older the generation, the more likely they are to think this way.
91% of 27-35 year olds want to see more windfall taxes
10% of people aged 73+ do not believe this is a good idea
In France, EDF is 84% publicly owned. Because of this, their household bills only rose by 4%. When the UK Government introduced the Energy Price Guarantee, our energy bills rose by 27%. Do you think we need to have more public ownership of our energy companies to keep price rises down?
Findings
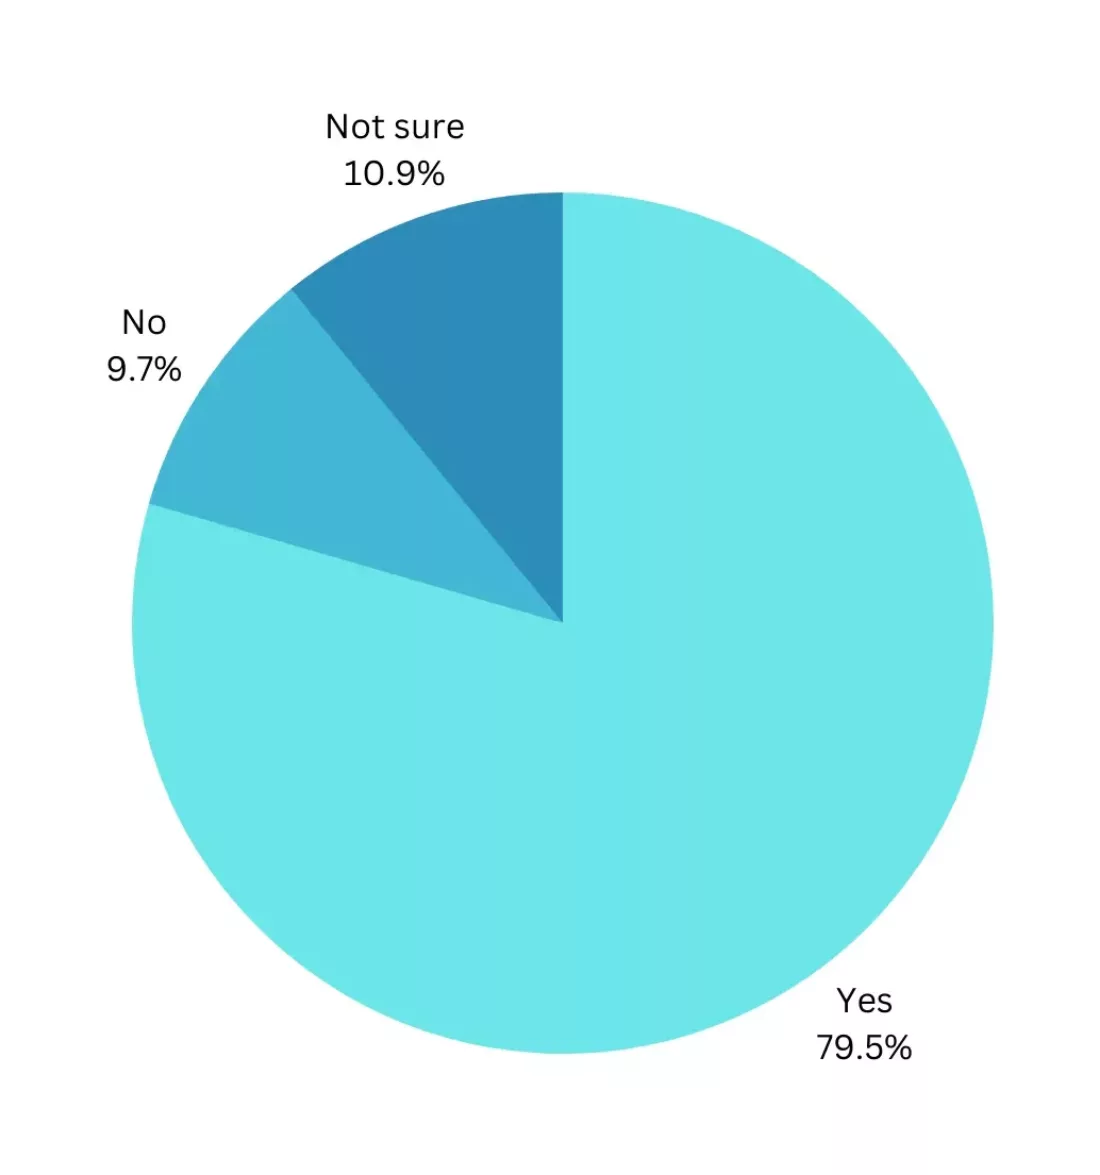
Public ownership of renewable energy systems is beneficial for all parties involved. Recent research has discovered that prices are generally 20-30% lower in companies that have public ownership. Countries like Sweden, Norway and Denmark own 100% of their biggest energy suppliers, and France is taking steps to reach 100% ownership of EDF. With this model, everyone has a stake in clean energy, jobs are created and any excess profits go straight into the government’s pocket, which can reduce energy bills. As such, just over 79% of UK homeowners believe public ownership will end the failures of privatisation. Almost 11% were not sure.
Just over 79% of people wish to see more public ownership of our energy companies
Under 10% of UK homeowners do not agree that energy prices will stay down with public ownership of energy companies
Breakdown by age
Findings
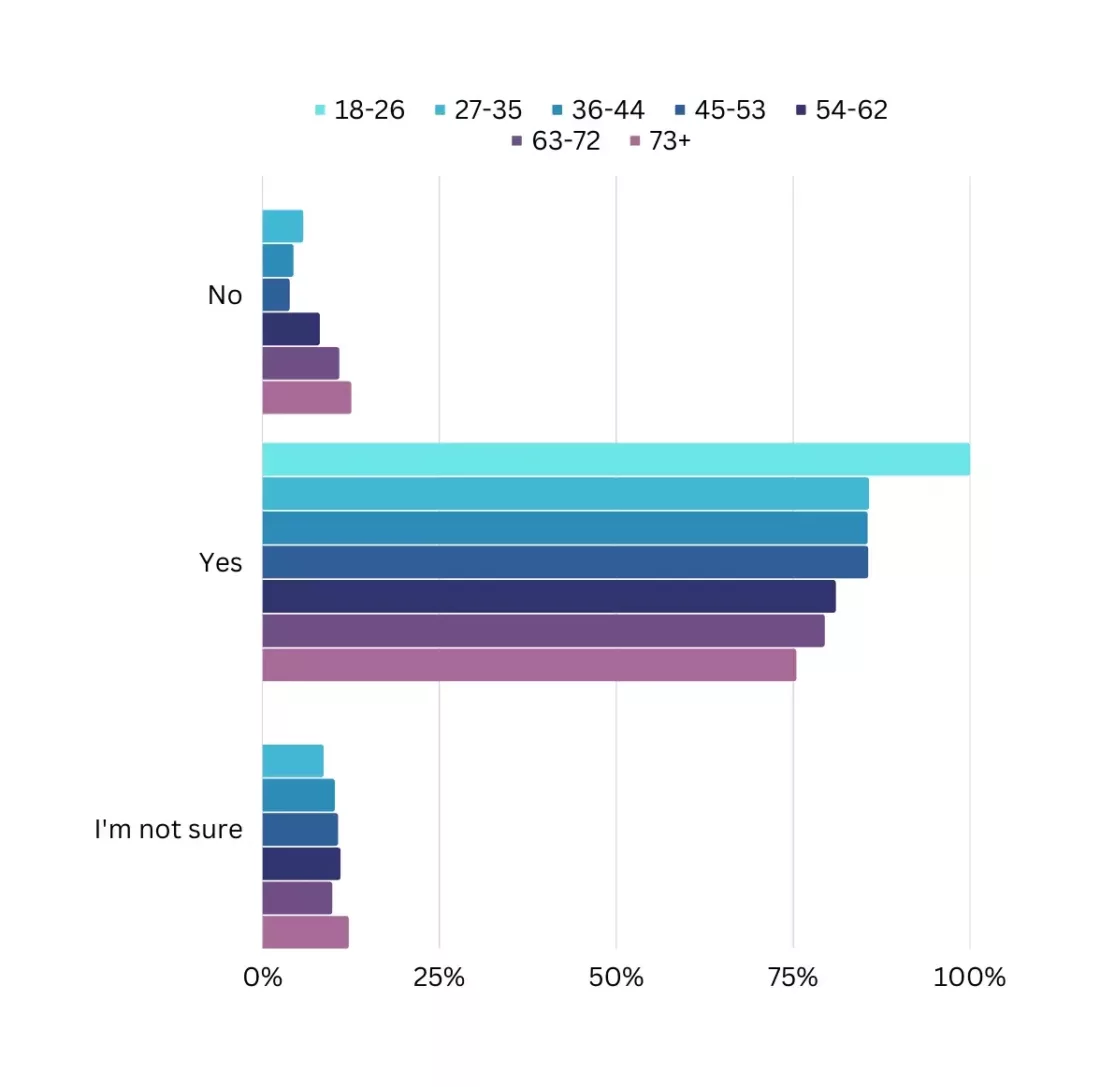
This is becoming more and more of a contentious issue in modern politics, thanks to the energy crisis. Generally speaking, the younger the generation, the more they are in favour of public ownership of energy companies. 100% of 18-26 year olds believe this should happen, compared to only just over ¾ of people aged 73+. Those least in favour are the oldest generation, with 12% of people not wanting to see this, compared to only 4% of 36-53 year olds.
Naturally, people are always unsure about these issues. Around 10% of all age groups didn’t want to say either way, with another 12% of people aged 73+ also unsure. Besides 18-26 year olds, the least unsure age group is 27-35 year olds.
100% of 18-26 year olds are in favour of further windfall taxes
12% of people aged 73+ are either unsure or not in favour
Survey Details and Methodology
The Home Energy Survey was compiled in order to analyse public feelings and awareness about various issues affecting the UK today. It was conducted in November 2022 and received over 3,300 responses across a range of 24 questions. Our sample consisted of residents all across the UK, encompassing a range of age demographics and incomes.
In order to provide a full and appropriate breakdown of the data, it went through a process of editing, verification and analysis. We also performed segmentation analysis in order to discover how different age groups responded to the questions.
If you wish to access the full data set collected by Eco Quote Today, please email info@leadinsight.co.uk
If you have a PR or news publication enquiry, please email info@ecoquotetoday.co.uk
Related articles
View all Solar Panel articles
A Complete Guide to Caravan Solar Panels
Are Solar Panels Worth It in Wales?

Project Solar UK: Company Overview
Battery Storage for Solar Panels Explained
Solar Panel Kits Explained - Everything You Need to Know

Are Solar Roofing Tiles Worth It?
A Complete Guide to Roof Integrated Solar Panels